Immigrants from Philippines vs Ottawa Wage/Income Gap
COMPARE
Immigrants from Philippines
Ottawa
Wage/Income Gap
Wage/Income Gap Comparison
Immigrants from Philippines
Ottawa
24.7%
WAGE/INCOME GAP
93.0/ 100
METRIC RATING
131st/ 347
METRIC RANK
27.0%
WAGE/INCOME GAP
5.3/ 100
METRIC RATING
230th/ 347
METRIC RANK
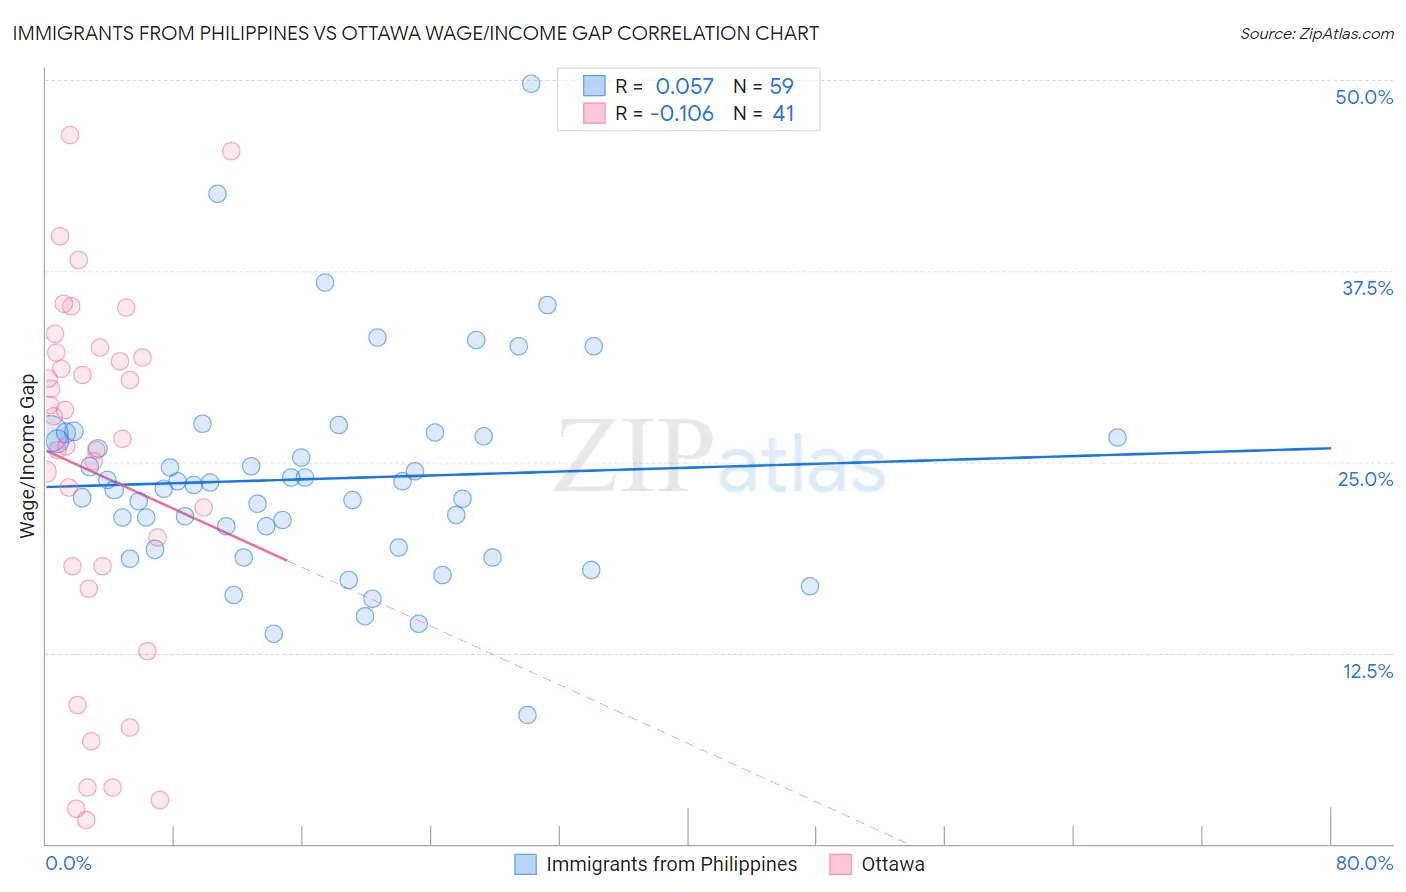
Immigrants from Philippines vs Ottawa Wage/Income Gap Correlation Chart
The statistical analysis conducted on geographies consisting of 470,842,100 people shows a slight positive correlation between the proportion of Immigrants from Philippines and wage/income gap percentage in the United States with a correlation coefficient (R) of 0.057 and weighted average of 24.7%. Similarly, the statistical analysis conducted on geographies consisting of 49,945,393 people shows a poor negative correlation between the proportion of Ottawa and wage/income gap percentage in the United States with a correlation coefficient (R) of -0.106 and weighted average of 27.0%, a difference of 9.3%.
Wage/Income Gap Correlation Summary
| Measurement | Immigrants from Philippines | Ottawa |
| Minimum | 8.4% | 1.6% |
| Maximum | 49.7% | 46.4% |
| Range | 41.3% | 44.8% |
| Mean | 23.9% | 24.3% |
| Median | 23.5% | 26.5% |
| Interquartile 25% (IQ1) | 19.4% | 17.4% |
| Interquartile 75% (IQ3) | 26.6% | 32.0% |
| Interquartile Range (IQR) | 7.3% | 14.6% |
| Standard Deviation (Sample) | 6.8% | 12.0% |
| Standard Deviation (Population) | 6.8% | 11.8% |
Similar Demographics by Wage/Income Gap
Demographics Similar to Immigrants from Philippines by Wage/Income Gap
In terms of wage/income gap, the demographic groups most similar to Immigrants from Philippines are Alsatian (24.7%, a difference of 0.070%), Yup'ik (24.7%, a difference of 0.090%), Immigrants from Central America (24.6%, a difference of 0.15%), Immigrants from Costa Rica (24.7%, a difference of 0.15%), and Colombian (24.7%, a difference of 0.15%).
| Demographics | Rating | Rank | Wage/Income Gap |
| Immigrants | South America | 93.9 /100 | #124 | Exceptional 24.6% |
| Spanish Americans | 93.8 /100 | #125 | Exceptional 24.6% |
| Immigrants | Uruguay | 93.8 /100 | #126 | Exceptional 24.6% |
| German Russians | 93.7 /100 | #127 | Exceptional 24.6% |
| Immigrants | Central America | 93.5 /100 | #128 | Exceptional 24.6% |
| Yup'ik | 93.3 /100 | #129 | Exceptional 24.7% |
| Alsatians | 93.2 /100 | #130 | Exceptional 24.7% |
| Immigrants | Philippines | 93.0 /100 | #131 | Exceptional 24.7% |
| Immigrants | Costa Rica | 92.4 /100 | #132 | Exceptional 24.7% |
| Colombians | 92.4 /100 | #133 | Exceptional 24.7% |
| Mexican American Indians | 92.2 /100 | #134 | Exceptional 24.7% |
| South American Indians | 92.0 /100 | #135 | Exceptional 24.7% |
| Armenians | 91.3 /100 | #136 | Exceptional 24.8% |
| Immigrants | South Eastern Asia | 90.9 /100 | #137 | Exceptional 24.8% |
| Immigrants | Bosnia and Herzegovina | 90.1 /100 | #138 | Exceptional 24.8% |
Demographics Similar to Ottawa by Wage/Income Gap
In terms of wage/income gap, the demographic groups most similar to Ottawa are Bhutanese (27.0%, a difference of 0.030%), Immigrants from Asia (27.0%, a difference of 0.050%), Argentinean (27.0%, a difference of 0.050%), Immigrants from Turkey (27.0%, a difference of 0.080%), and Spaniard (27.0%, a difference of 0.090%).
| Demographics | Rating | Rank | Wage/Income Gap |
| Jordanians | 8.0 /100 | #223 | Tragic 26.8% |
| Immigrants | Argentina | 7.2 /100 | #224 | Tragic 26.8% |
| Immigrants | Ireland | 6.5 /100 | #225 | Tragic 26.9% |
| Asians | 5.9 /100 | #226 | Tragic 26.9% |
| Spaniards | 5.6 /100 | #227 | Tragic 27.0% |
| Immigrants | Turkey | 5.6 /100 | #228 | Tragic 27.0% |
| Immigrants | Asia | 5.5 /100 | #229 | Tragic 27.0% |
| Ottawa | 5.3 /100 | #230 | Tragic 27.0% |
| Bhutanese | 5.3 /100 | #231 | Tragic 27.0% |
| Argentineans | 5.2 /100 | #232 | Tragic 27.0% |
| Immigrants | Brazil | 5.0 /100 | #233 | Tragic 27.0% |
| Immigrants | Pakistan | 4.9 /100 | #234 | Tragic 27.0% |
| Immigrants | Hungary | 4.8 /100 | #235 | Tragic 27.0% |
| Immigrants | Romania | 4.8 /100 | #236 | Tragic 27.0% |
| Immigrants | Eastern Asia | 4.4 /100 | #237 | Tragic 27.1% |