Immigrants from Hungary vs Yugoslavian Wage/Income Gap
COMPARE
Immigrants from Hungary
Yugoslavian
Wage/Income Gap
Wage/Income Gap Comparison
Immigrants from Hungary
Yugoslavians
27.0%
WAGE/INCOME GAP
4.8/ 100
METRIC RATING
235th/ 347
METRIC RANK
26.7%
WAGE/INCOME GAP
9.7/ 100
METRIC RATING
215th/ 347
METRIC RANK
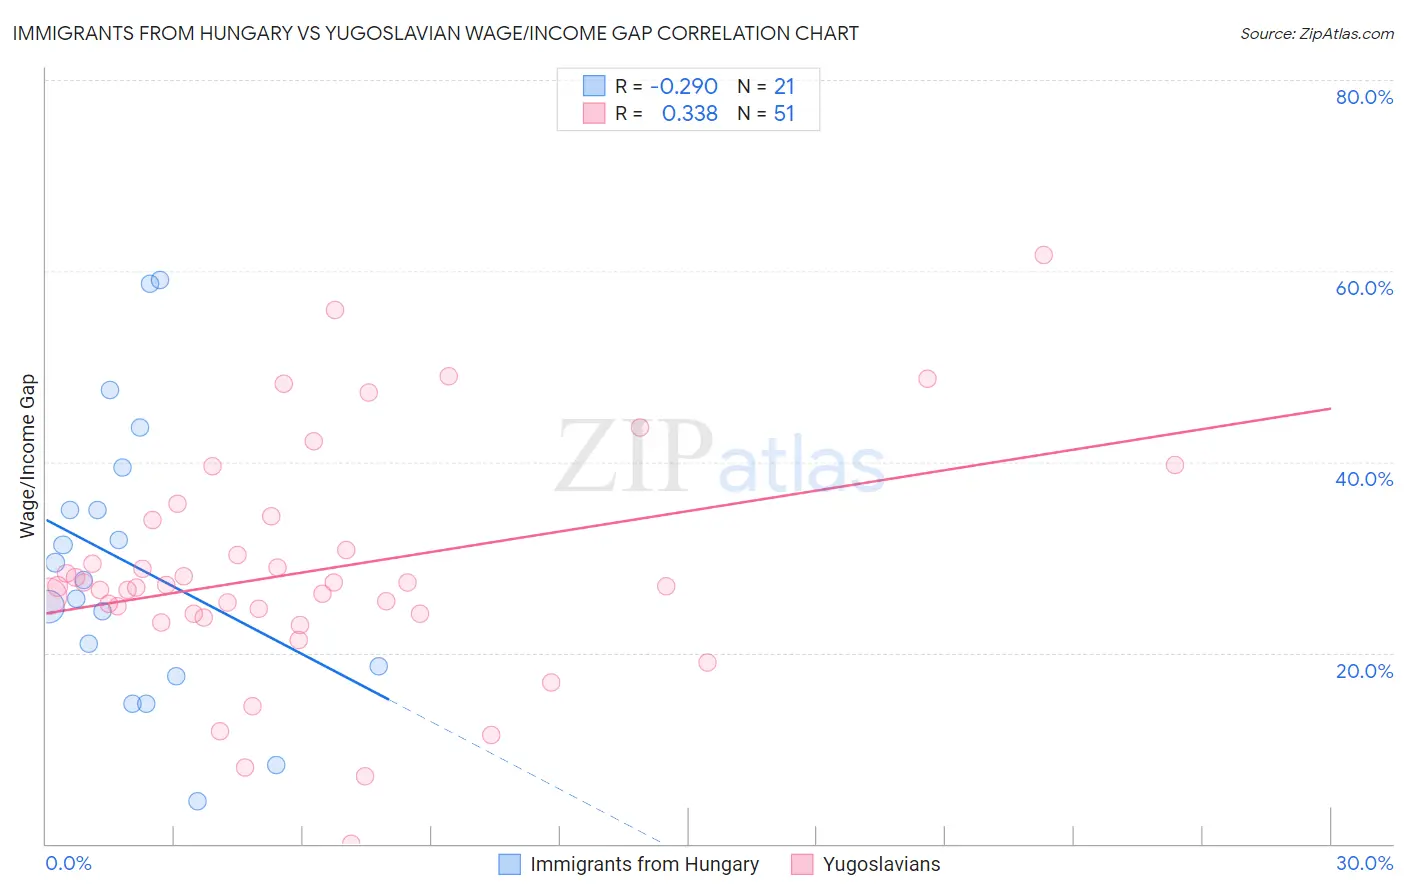
Immigrants from Hungary vs Yugoslavian Wage/Income Gap Correlation Chart
The statistical analysis conducted on geographies consisting of 195,626,970 people shows a weak negative correlation between the proportion of Immigrants from Hungary and wage/income gap percentage in the United States with a correlation coefficient (R) of -0.290 and weighted average of 27.0%. Similarly, the statistical analysis conducted on geographies consisting of 285,593,717 people shows a mild positive correlation between the proportion of Yugoslavians and wage/income gap percentage in the United States with a correlation coefficient (R) of 0.338 and weighted average of 26.7%, a difference of 1.2%.
Wage/Income Gap Correlation Summary
| Measurement | Immigrants from Hungary | Yugoslavian |
| Minimum | 4.4% | 0.038% |
| Maximum | 59.1% | 61.7% |
| Range | 54.6% | 61.6% |
| Mean | 29.2% | 28.6% |
| Median | 27.6% | 27.0% |
| Interquartile 25% (IQ1) | 18.1% | 24.1% |
| Interquartile 75% (IQ3) | 37.2% | 33.9% |
| Interquartile Range (IQR) | 19.1% | 9.8% |
| Standard Deviation (Sample) | 14.7% | 12.0% |
| Standard Deviation (Population) | 14.4% | 11.8% |
Demographics Similar to Immigrants from Hungary and Yugoslavians by Wage/Income Gap
In terms of wage/income gap, the demographic groups most similar to Immigrants from Hungary are Immigrants from Pakistan (27.0%, a difference of 0.010%), Immigrants from Brazil (27.0%, a difference of 0.060%), Argentinean (27.0%, a difference of 0.12%), Bhutanese (27.0%, a difference of 0.15%), and Ottawa (27.0%, a difference of 0.17%). Similarly, the demographic groups most similar to Yugoslavians are Immigrants from Portugal (26.7%, a difference of 0.040%), Brazilian (26.7%, a difference of 0.10%), Immigrants from Saudi Arabia (26.7%, a difference of 0.12%), Immigrants from Poland (26.7%, a difference of 0.15%), and Immigrants from Latvia (26.7%, a difference of 0.17%).
| Demographics | Rating | Rank | Wage/Income Gap |
| Yugoslavians | 9.7 /100 | #215 | Tragic 26.7% |
| Immigrants | Portugal | 9.5 /100 | #216 | Tragic 26.7% |
| Brazilians | 9.2 /100 | #217 | Tragic 26.7% |
| Immigrants | Saudi Arabia | 9.1 /100 | #218 | Tragic 26.7% |
| Immigrants | Poland | 8.9 /100 | #219 | Tragic 26.7% |
| Immigrants | Latvia | 8.9 /100 | #220 | Tragic 26.7% |
| Immigrants | Spain | 8.5 /100 | #221 | Tragic 26.8% |
| Bolivians | 8.3 /100 | #222 | Tragic 26.8% |
| Jordanians | 8.0 /100 | #223 | Tragic 26.8% |
| Immigrants | Argentina | 7.2 /100 | #224 | Tragic 26.8% |
| Immigrants | Ireland | 6.5 /100 | #225 | Tragic 26.9% |
| Asians | 5.9 /100 | #226 | Tragic 26.9% |
| Spaniards | 5.6 /100 | #227 | Tragic 27.0% |
| Immigrants | Turkey | 5.6 /100 | #228 | Tragic 27.0% |
| Immigrants | Asia | 5.5 /100 | #229 | Tragic 27.0% |
| Ottawa | 5.3 /100 | #230 | Tragic 27.0% |
| Bhutanese | 5.3 /100 | #231 | Tragic 27.0% |
| Argentineans | 5.2 /100 | #232 | Tragic 27.0% |
| Immigrants | Brazil | 5.0 /100 | #233 | Tragic 27.0% |
| Immigrants | Pakistan | 4.9 /100 | #234 | Tragic 27.0% |
| Immigrants | Hungary | 4.8 /100 | #235 | Tragic 27.0% |