Immigrants from Hungary vs Dutch Wage/Income Gap
COMPARE
Immigrants from Hungary
Dutch
Wage/Income Gap
Wage/Income Gap Comparison
Immigrants from Hungary
Dutch
27.0%
WAGE/INCOME GAP
4.8/ 100
METRIC RATING
235th/ 347
METRIC RANK
29.6%
WAGE/INCOME GAP
0.0/ 100
METRIC RATING
337th/ 347
METRIC RANK
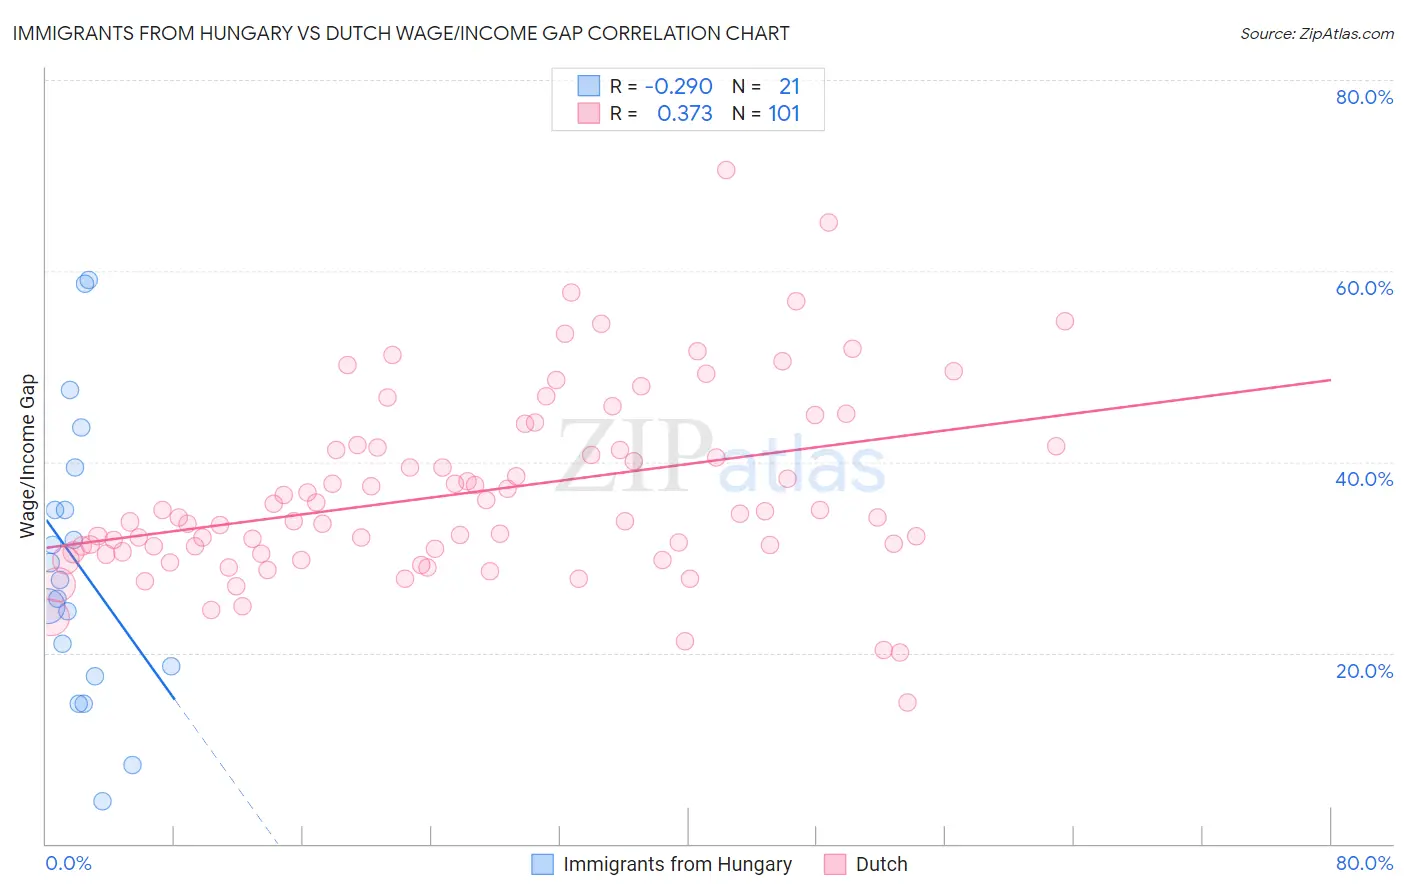
Immigrants from Hungary vs Dutch Wage/Income Gap Correlation Chart
The statistical analysis conducted on geographies consisting of 195,626,970 people shows a weak negative correlation between the proportion of Immigrants from Hungary and wage/income gap percentage in the United States with a correlation coefficient (R) of -0.290 and weighted average of 27.0%. Similarly, the statistical analysis conducted on geographies consisting of 552,244,152 people shows a mild positive correlation between the proportion of Dutch and wage/income gap percentage in the United States with a correlation coefficient (R) of 0.373 and weighted average of 29.6%, a difference of 9.7%.
Wage/Income Gap Correlation Summary
| Measurement | Immigrants from Hungary | Dutch |
| Minimum | 4.4% | 14.8% |
| Maximum | 59.1% | 70.6% |
| Range | 54.6% | 55.8% |
| Mean | 29.2% | 36.8% |
| Median | 27.6% | 34.2% |
| Interquartile 25% (IQ1) | 18.1% | 30.6% |
| Interquartile 75% (IQ3) | 37.2% | 41.5% |
| Interquartile Range (IQR) | 19.1% | 11.0% |
| Standard Deviation (Sample) | 14.7% | 9.7% |
| Standard Deviation (Population) | 14.4% | 9.7% |
Similar Demographics by Wage/Income Gap
Demographics Similar to Immigrants from Hungary by Wage/Income Gap
In terms of wage/income gap, the demographic groups most similar to Immigrants from Hungary are Immigrants from Pakistan (27.0%, a difference of 0.010%), Immigrants from Romania (27.0%, a difference of 0.020%), Immigrants from Brazil (27.0%, a difference of 0.060%), Argentinean (27.0%, a difference of 0.12%), and Bhutanese (27.0%, a difference of 0.15%).
| Demographics | Rating | Rank | Wage/Income Gap |
| Immigrants | Turkey | 5.6 /100 | #228 | Tragic 27.0% |
| Immigrants | Asia | 5.5 /100 | #229 | Tragic 27.0% |
| Ottawa | 5.3 /100 | #230 | Tragic 27.0% |
| Bhutanese | 5.3 /100 | #231 | Tragic 27.0% |
| Argentineans | 5.2 /100 | #232 | Tragic 27.0% |
| Immigrants | Brazil | 5.0 /100 | #233 | Tragic 27.0% |
| Immigrants | Pakistan | 4.9 /100 | #234 | Tragic 27.0% |
| Immigrants | Hungary | 4.8 /100 | #235 | Tragic 27.0% |
| Immigrants | Romania | 4.8 /100 | #236 | Tragic 27.0% |
| Immigrants | Eastern Asia | 4.4 /100 | #237 | Tragic 27.1% |
| Osage | 4.4 /100 | #238 | Tragic 27.1% |
| Estonians | 4.3 /100 | #239 | Tragic 27.1% |
| Immigrants | Europe | 3.8 /100 | #240 | Tragic 27.1% |
| Creek | 3.8 /100 | #241 | Tragic 27.1% |
| Immigrants | Sri Lanka | 3.7 /100 | #242 | Tragic 27.1% |
Demographics Similar to Dutch by Wage/Income Gap
In terms of wage/income gap, the demographic groups most similar to Dutch are Filipino (29.7%, a difference of 0.22%), Iranian (29.7%, a difference of 0.28%), English (29.5%, a difference of 0.58%), Immigrants from Taiwan (29.5%, a difference of 0.59%), and Swedish (29.4%, a difference of 0.72%).
| Demographics | Rating | Rank | Wage/Income Gap |
| Germans | 0.0 /100 | #330 | Tragic 29.2% |
| Czechs | 0.0 /100 | #331 | Tragic 29.2% |
| Immigrants | South Central Asia | 0.0 /100 | #332 | Tragic 29.3% |
| Europeans | 0.0 /100 | #333 | Tragic 29.4% |
| Swedes | 0.0 /100 | #334 | Tragic 29.4% |
| Immigrants | Taiwan | 0.0 /100 | #335 | Tragic 29.5% |
| English | 0.0 /100 | #336 | Tragic 29.5% |
| Dutch | 0.0 /100 | #337 | Tragic 29.6% |
| Filipinos | 0.0 /100 | #338 | Tragic 29.7% |
| Iranians | 0.0 /100 | #339 | Tragic 29.7% |
| Swiss | 0.0 /100 | #340 | Tragic 30.0% |
| Thais | 0.0 /100 | #341 | Tragic 30.5% |
| Pennsylvania Germans | 0.0 /100 | #342 | Tragic 30.7% |
| Danes | 0.0 /100 | #343 | Tragic 31.0% |
| Assyrians/Chaldeans/Syriacs | 0.0 /100 | #344 | Tragic 31.0% |