Immigrants from Hungary vs Immigrants from Korea Wage/Income Gap
COMPARE
Immigrants from Hungary
Immigrants from Korea
Wage/Income Gap
Wage/Income Gap Comparison
Immigrants from Hungary
Immigrants from Korea
27.0%
WAGE/INCOME GAP
4.8/ 100
METRIC RATING
235th/ 347
METRIC RANK
27.8%
WAGE/INCOME GAP
0.8/ 100
METRIC RATING
272nd/ 347
METRIC RANK
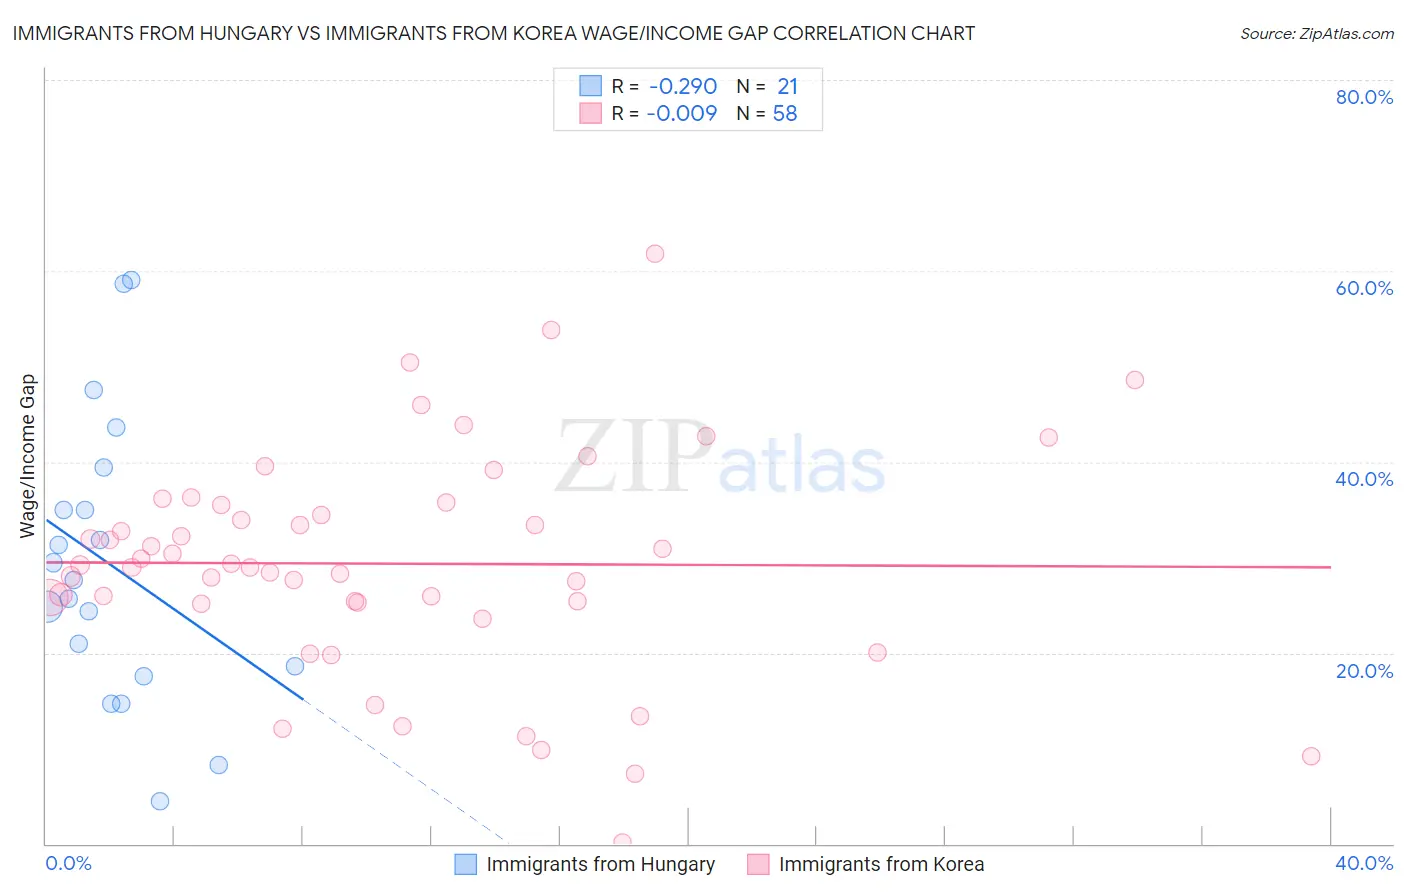
Immigrants from Hungary vs Immigrants from Korea Wage/Income Gap Correlation Chart
The statistical analysis conducted on geographies consisting of 195,626,970 people shows a weak negative correlation between the proportion of Immigrants from Hungary and wage/income gap percentage in the United States with a correlation coefficient (R) of -0.290 and weighted average of 27.0%. Similarly, the statistical analysis conducted on geographies consisting of 416,007,882 people shows no correlation between the proportion of Immigrants from Korea and wage/income gap percentage in the United States with a correlation coefficient (R) of -0.009 and weighted average of 27.8%, a difference of 2.9%.
Wage/Income Gap Correlation Summary
| Measurement | Immigrants from Hungary | Immigrants from Korea |
| Minimum | 4.4% | 0.13% |
| Maximum | 59.1% | 61.8% |
| Range | 54.6% | 61.7% |
| Mean | 29.2% | 29.3% |
| Median | 27.6% | 29.1% |
| Interquartile 25% (IQ1) | 18.1% | 25.3% |
| Interquartile 75% (IQ3) | 37.2% | 35.5% |
| Interquartile Range (IQR) | 19.1% | 10.2% |
| Standard Deviation (Sample) | 14.7% | 11.7% |
| Standard Deviation (Population) | 14.4% | 11.6% |
Similar Demographics by Wage/Income Gap
Demographics Similar to Immigrants from Hungary by Wage/Income Gap
In terms of wage/income gap, the demographic groups most similar to Immigrants from Hungary are Immigrants from Pakistan (27.0%, a difference of 0.010%), Immigrants from Romania (27.0%, a difference of 0.020%), Immigrants from Brazil (27.0%, a difference of 0.060%), Argentinean (27.0%, a difference of 0.12%), and Bhutanese (27.0%, a difference of 0.15%).
| Demographics | Rating | Rank | Wage/Income Gap |
| Immigrants | Turkey | 5.6 /100 | #228 | Tragic 27.0% |
| Immigrants | Asia | 5.5 /100 | #229 | Tragic 27.0% |
| Ottawa | 5.3 /100 | #230 | Tragic 27.0% |
| Bhutanese | 5.3 /100 | #231 | Tragic 27.0% |
| Argentineans | 5.2 /100 | #232 | Tragic 27.0% |
| Immigrants | Brazil | 5.0 /100 | #233 | Tragic 27.0% |
| Immigrants | Pakistan | 4.9 /100 | #234 | Tragic 27.0% |
| Immigrants | Hungary | 4.8 /100 | #235 | Tragic 27.0% |
| Immigrants | Romania | 4.8 /100 | #236 | Tragic 27.0% |
| Immigrants | Eastern Asia | 4.4 /100 | #237 | Tragic 27.1% |
| Osage | 4.4 /100 | #238 | Tragic 27.1% |
| Estonians | 4.3 /100 | #239 | Tragic 27.1% |
| Immigrants | Europe | 3.8 /100 | #240 | Tragic 27.1% |
| Creek | 3.8 /100 | #241 | Tragic 27.1% |
| Immigrants | Sri Lanka | 3.7 /100 | #242 | Tragic 27.1% |
Demographics Similar to Immigrants from Korea by Wage/Income Gap
In terms of wage/income gap, the demographic groups most similar to Immigrants from Korea are Ute (27.8%, a difference of 0.070%), Bulgarian (27.8%, a difference of 0.11%), Immigrants from Western Europe (27.8%, a difference of 0.15%), American (27.8%, a difference of 0.15%), and Immigrants from Japan (27.9%, a difference of 0.23%).
| Demographics | Rating | Rank | Wage/Income Gap |
| Serbians | 1.0 /100 | #265 | Tragic 27.7% |
| Hmong | 1.0 /100 | #266 | Tragic 27.7% |
| Turks | 1.0 /100 | #267 | Tragic 27.7% |
| New Zealanders | 1.0 /100 | #268 | Tragic 27.7% |
| Potawatomi | 0.9 /100 | #269 | Tragic 27.7% |
| Immigrants | Western Europe | 0.9 /100 | #270 | Tragic 27.8% |
| Ute | 0.8 /100 | #271 | Tragic 27.8% |
| Immigrants | Korea | 0.8 /100 | #272 | Tragic 27.8% |
| Bulgarians | 0.7 /100 | #273 | Tragic 27.8% |
| Americans | 0.7 /100 | #274 | Tragic 27.8% |
| Immigrants | Japan | 0.7 /100 | #275 | Tragic 27.9% |
| Lebanese | 0.7 /100 | #276 | Tragic 27.9% |
| Latvians | 0.7 /100 | #277 | Tragic 27.9% |
| Immigrants | England | 0.6 /100 | #278 | Tragic 27.9% |
| Romanians | 0.5 /100 | #279 | Tragic 28.0% |