Immigrants from Hungary vs Immigrants from Fiji Wage/Income Gap
COMPARE
Immigrants from Hungary
Immigrants from Fiji
Wage/Income Gap
Wage/Income Gap Comparison
Immigrants from Hungary
Immigrants from Fiji
27.0%
WAGE/INCOME GAP
4.8/ 100
METRIC RATING
235th/ 347
METRIC RANK
22.4%
WAGE/INCOME GAP
100.0/ 100
METRIC RATING
61st/ 347
METRIC RANK
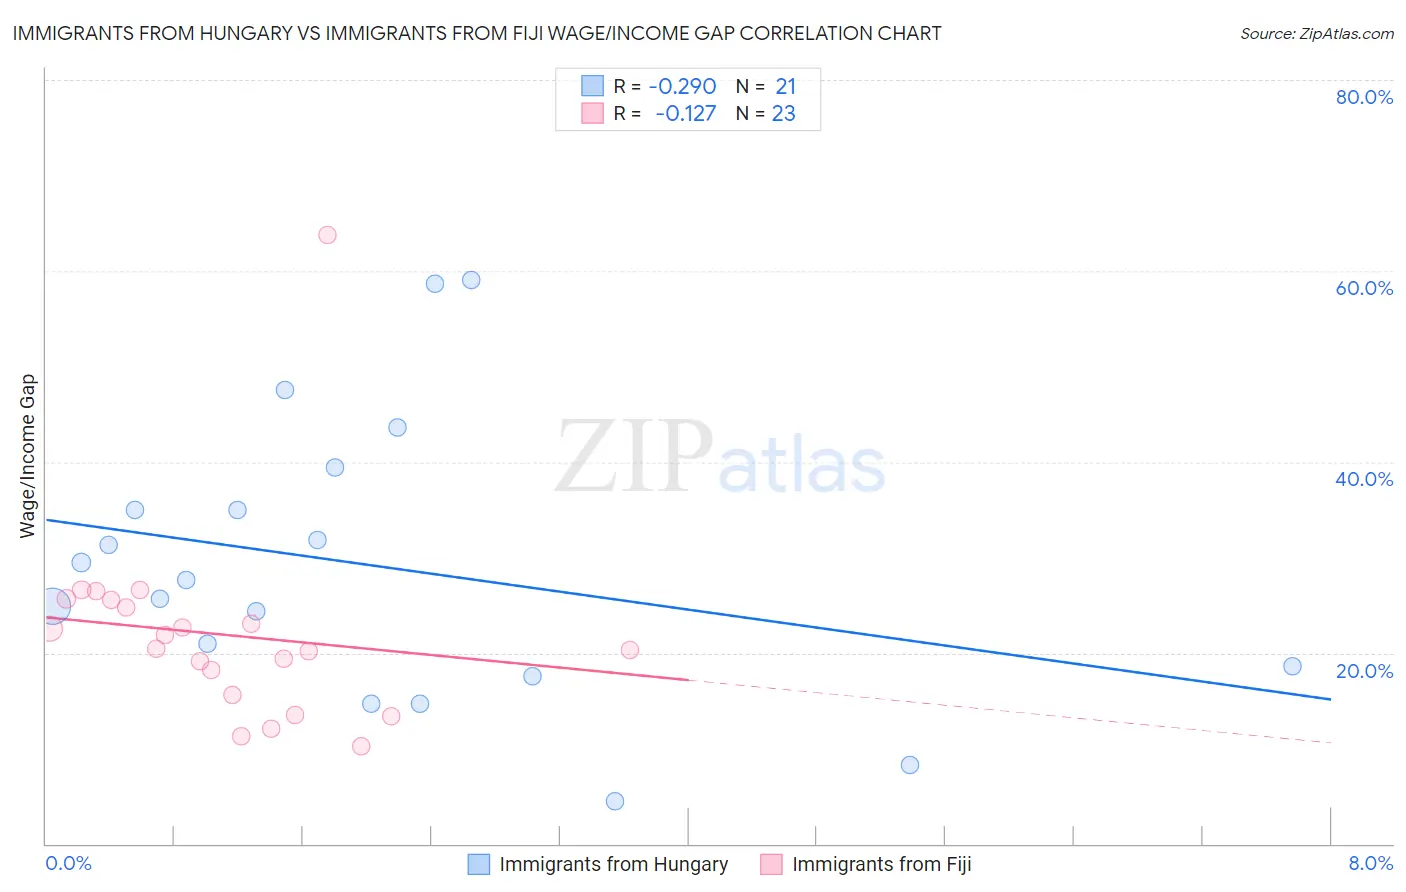
Immigrants from Hungary vs Immigrants from Fiji Wage/Income Gap Correlation Chart
The statistical analysis conducted on geographies consisting of 195,626,970 people shows a weak negative correlation between the proportion of Immigrants from Hungary and wage/income gap percentage in the United States with a correlation coefficient (R) of -0.290 and weighted average of 27.0%. Similarly, the statistical analysis conducted on geographies consisting of 93,739,625 people shows a poor negative correlation between the proportion of Immigrants from Fiji and wage/income gap percentage in the United States with a correlation coefficient (R) of -0.127 and weighted average of 22.4%, a difference of 20.6%.
Wage/Income Gap Correlation Summary
| Measurement | Immigrants from Hungary | Immigrants from Fiji |
| Minimum | 4.4% | 10.2% |
| Maximum | 59.1% | 63.8% |
| Range | 54.6% | 53.5% |
| Mean | 29.2% | 21.9% |
| Median | 27.6% | 20.5% |
| Interquartile 25% (IQ1) | 18.1% | 15.6% |
| Interquartile 75% (IQ3) | 37.2% | 25.6% |
| Interquartile Range (IQR) | 19.1% | 10.0% |
| Standard Deviation (Sample) | 14.7% | 10.5% |
| Standard Deviation (Population) | 14.4% | 10.3% |
Similar Demographics by Wage/Income Gap
Demographics Similar to Immigrants from Hungary by Wage/Income Gap
In terms of wage/income gap, the demographic groups most similar to Immigrants from Hungary are Immigrants from Pakistan (27.0%, a difference of 0.010%), Immigrants from Romania (27.0%, a difference of 0.020%), Immigrants from Brazil (27.0%, a difference of 0.060%), Argentinean (27.0%, a difference of 0.12%), and Bhutanese (27.0%, a difference of 0.15%).
| Demographics | Rating | Rank | Wage/Income Gap |
| Immigrants | Turkey | 5.6 /100 | #228 | Tragic 27.0% |
| Immigrants | Asia | 5.5 /100 | #229 | Tragic 27.0% |
| Ottawa | 5.3 /100 | #230 | Tragic 27.0% |
| Bhutanese | 5.3 /100 | #231 | Tragic 27.0% |
| Argentineans | 5.2 /100 | #232 | Tragic 27.0% |
| Immigrants | Brazil | 5.0 /100 | #233 | Tragic 27.0% |
| Immigrants | Pakistan | 4.9 /100 | #234 | Tragic 27.0% |
| Immigrants | Hungary | 4.8 /100 | #235 | Tragic 27.0% |
| Immigrants | Romania | 4.8 /100 | #236 | Tragic 27.0% |
| Immigrants | Eastern Asia | 4.4 /100 | #237 | Tragic 27.1% |
| Osage | 4.4 /100 | #238 | Tragic 27.1% |
| Estonians | 4.3 /100 | #239 | Tragic 27.1% |
| Immigrants | Europe | 3.8 /100 | #240 | Tragic 27.1% |
| Creek | 3.8 /100 | #241 | Tragic 27.1% |
| Immigrants | Sri Lanka | 3.7 /100 | #242 | Tragic 27.1% |
Demographics Similar to Immigrants from Fiji by Wage/Income Gap
In terms of wage/income gap, the demographic groups most similar to Immigrants from Fiji are Immigrants from Middle Africa (22.4%, a difference of 0.17%), Navajo (22.4%, a difference of 0.19%), Immigrants from Guatemala (22.5%, a difference of 0.21%), Immigrants from Cuba (22.4%, a difference of 0.23%), and Ghanaian (22.3%, a difference of 0.31%).
| Demographics | Rating | Rank | Wage/Income Gap |
| Nepalese | 100.0 /100 | #54 | Exceptional 22.2% |
| Immigrants | Zaire | 100.0 /100 | #55 | Exceptional 22.3% |
| Immigrants | Ghana | 100.0 /100 | #56 | Exceptional 22.3% |
| Ghanaians | 100.0 /100 | #57 | Exceptional 22.3% |
| Immigrants | Cuba | 100.0 /100 | #58 | Exceptional 22.4% |
| Navajo | 100.0 /100 | #59 | Exceptional 22.4% |
| Immigrants | Middle Africa | 100.0 /100 | #60 | Exceptional 22.4% |
| Immigrants | Fiji | 100.0 /100 | #61 | Exceptional 22.4% |
| Immigrants | Guatemala | 100.0 /100 | #62 | Exceptional 22.5% |
| Immigrants | Ecuador | 100.0 /100 | #63 | Exceptional 22.5% |
| Spanish American Indians | 100.0 /100 | #64 | Exceptional 22.5% |
| Guatemalans | 99.9 /100 | #65 | Exceptional 22.6% |
| Central American Indians | 99.9 /100 | #66 | Exceptional 22.7% |
| Menominee | 99.9 /100 | #67 | Exceptional 22.7% |
| Immigrants | Nigeria | 99.9 /100 | #68 | Exceptional 22.7% |