Iroquois vs Yugoslavian Wage/Income Gap
COMPARE
Iroquois
Yugoslavian
Wage/Income Gap
Wage/Income Gap Comparison
Iroquois
Yugoslavians
25.1%
WAGE/INCOME GAP
83.9/ 100
METRIC RATING
148th/ 347
METRIC RANK
26.7%
WAGE/INCOME GAP
9.7/ 100
METRIC RATING
215th/ 347
METRIC RANK
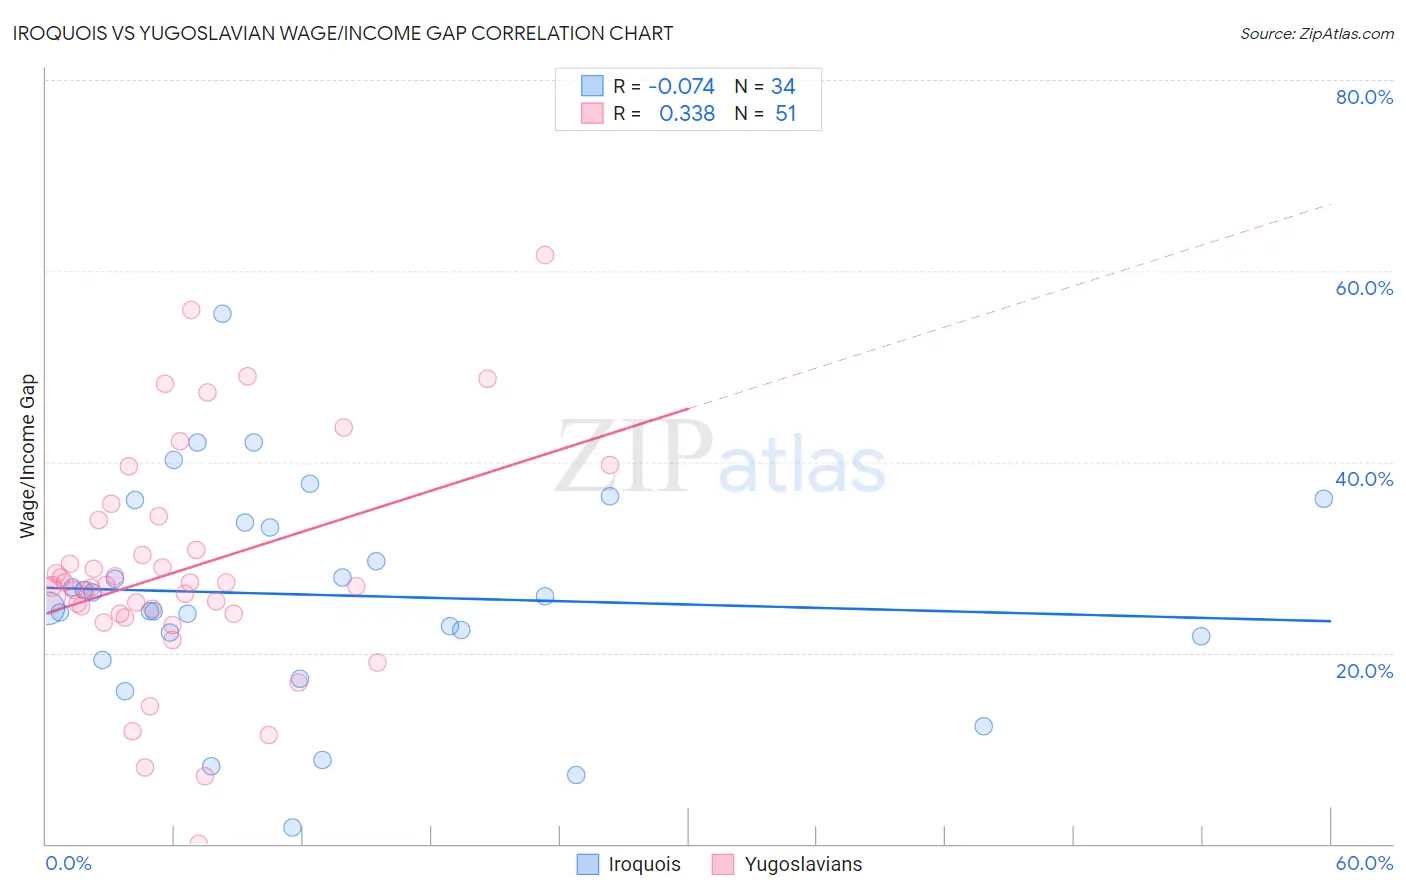
Iroquois vs Yugoslavian Wage/Income Gap Correlation Chart
The statistical analysis conducted on geographies consisting of 207,171,754 people shows a slight negative correlation between the proportion of Iroquois and wage/income gap percentage in the United States with a correlation coefficient (R) of -0.074 and weighted average of 25.1%. Similarly, the statistical analysis conducted on geographies consisting of 285,593,717 people shows a mild positive correlation between the proportion of Yugoslavians and wage/income gap percentage in the United States with a correlation coefficient (R) of 0.338 and weighted average of 26.7%, a difference of 6.5%.
Wage/Income Gap Correlation Summary
| Measurement | Iroquois | Yugoslavian |
| Minimum | 1.6% | 0.038% |
| Maximum | 55.5% | 61.7% |
| Range | 53.9% | 61.6% |
| Mean | 26.0% | 28.6% |
| Median | 25.3% | 27.0% |
| Interquartile 25% (IQ1) | 21.8% | 24.1% |
| Interquartile 75% (IQ3) | 33.6% | 33.9% |
| Interquartile Range (IQR) | 11.8% | 9.8% |
| Standard Deviation (Sample) | 11.3% | 12.0% |
| Standard Deviation (Population) | 11.1% | 11.8% |
Similar Demographics by Wage/Income Gap
Demographics Similar to Iroquois by Wage/Income Gap
In terms of wage/income gap, the demographic groups most similar to Iroquois are Malaysian (25.0%, a difference of 0.14%), Immigrants from Peru (25.1%, a difference of 0.15%), Comanche (25.0%, a difference of 0.16%), South American (25.0%, a difference of 0.16%), and Immigrants (25.1%, a difference of 0.19%).
| Demographics | Rating | Rank | Wage/Income Gap |
| Hawaiians | 89.3 /100 | #141 | Excellent 24.9% |
| Afghans | 88.1 /100 | #142 | Excellent 24.9% |
| Immigrants | Uganda | 88.0 /100 | #143 | Excellent 24.9% |
| Chippewa | 86.9 /100 | #144 | Excellent 25.0% |
| Comanche | 85.2 /100 | #145 | Excellent 25.0% |
| South Americans | 85.2 /100 | #146 | Excellent 25.0% |
| Malaysians | 84.9 /100 | #147 | Excellent 25.0% |
| Iroquois | 83.9 /100 | #148 | Excellent 25.1% |
| Immigrants | Peru | 82.6 /100 | #149 | Excellent 25.1% |
| Immigrants | Immigrants | 82.3 /100 | #150 | Excellent 25.1% |
| Taiwanese | 81.6 /100 | #151 | Excellent 25.1% |
| Uruguayans | 81.3 /100 | #152 | Excellent 25.2% |
| Blackfeet | 78.1 /100 | #153 | Good 25.2% |
| Immigrants | Northern Africa | 78.1 /100 | #154 | Good 25.2% |
| Immigrants | Vietnam | 77.7 /100 | #155 | Good 25.2% |
Demographics Similar to Yugoslavians by Wage/Income Gap
In terms of wage/income gap, the demographic groups most similar to Yugoslavians are Immigrants from Portugal (26.7%, a difference of 0.040%), Immigrants from China (26.7%, a difference of 0.090%), Immigrants from Iraq (26.7%, a difference of 0.10%), Brazilian (26.7%, a difference of 0.10%), and Immigrants from Saudi Arabia (26.7%, a difference of 0.12%).
| Demographics | Rating | Rank | Wage/Income Gap |
| Egyptians | 12.7 /100 | #208 | Poor 26.6% |
| Immigrants | Kuwait | 12.6 /100 | #209 | Poor 26.6% |
| Arabs | 12.3 /100 | #210 | Poor 26.6% |
| Mongolians | 11.4 /100 | #211 | Poor 26.6% |
| Iraqis | 11.2 /100 | #212 | Poor 26.6% |
| Immigrants | Iraq | 10.3 /100 | #213 | Poor 26.7% |
| Immigrants | China | 10.3 /100 | #214 | Poor 26.7% |
| Yugoslavians | 9.7 /100 | #215 | Tragic 26.7% |
| Immigrants | Portugal | 9.5 /100 | #216 | Tragic 26.7% |
| Brazilians | 9.2 /100 | #217 | Tragic 26.7% |
| Immigrants | Saudi Arabia | 9.1 /100 | #218 | Tragic 26.7% |
| Immigrants | Poland | 8.9 /100 | #219 | Tragic 26.7% |
| Immigrants | Latvia | 8.9 /100 | #220 | Tragic 26.7% |
| Immigrants | Spain | 8.5 /100 | #221 | Tragic 26.8% |
| Bolivians | 8.3 /100 | #222 | Tragic 26.8% |