Immigrants from Burma/Myanmar vs Immigrants from Laos Median Female Earnings
COMPARE
Immigrants from Burma/Myanmar
Immigrants from Laos
Median Female Earnings
Median Female Earnings Comparison
Immigrants from Burma/Myanmar
Immigrants from Laos
$38,028
MEDIAN FEMALE EARNINGS
3.0/ 100
METRIC RATING
242nd/ 347
METRIC RANK
$36,841
MEDIAN FEMALE EARNINGS
0.3/ 100
METRIC RATING
273rd/ 347
METRIC RANK
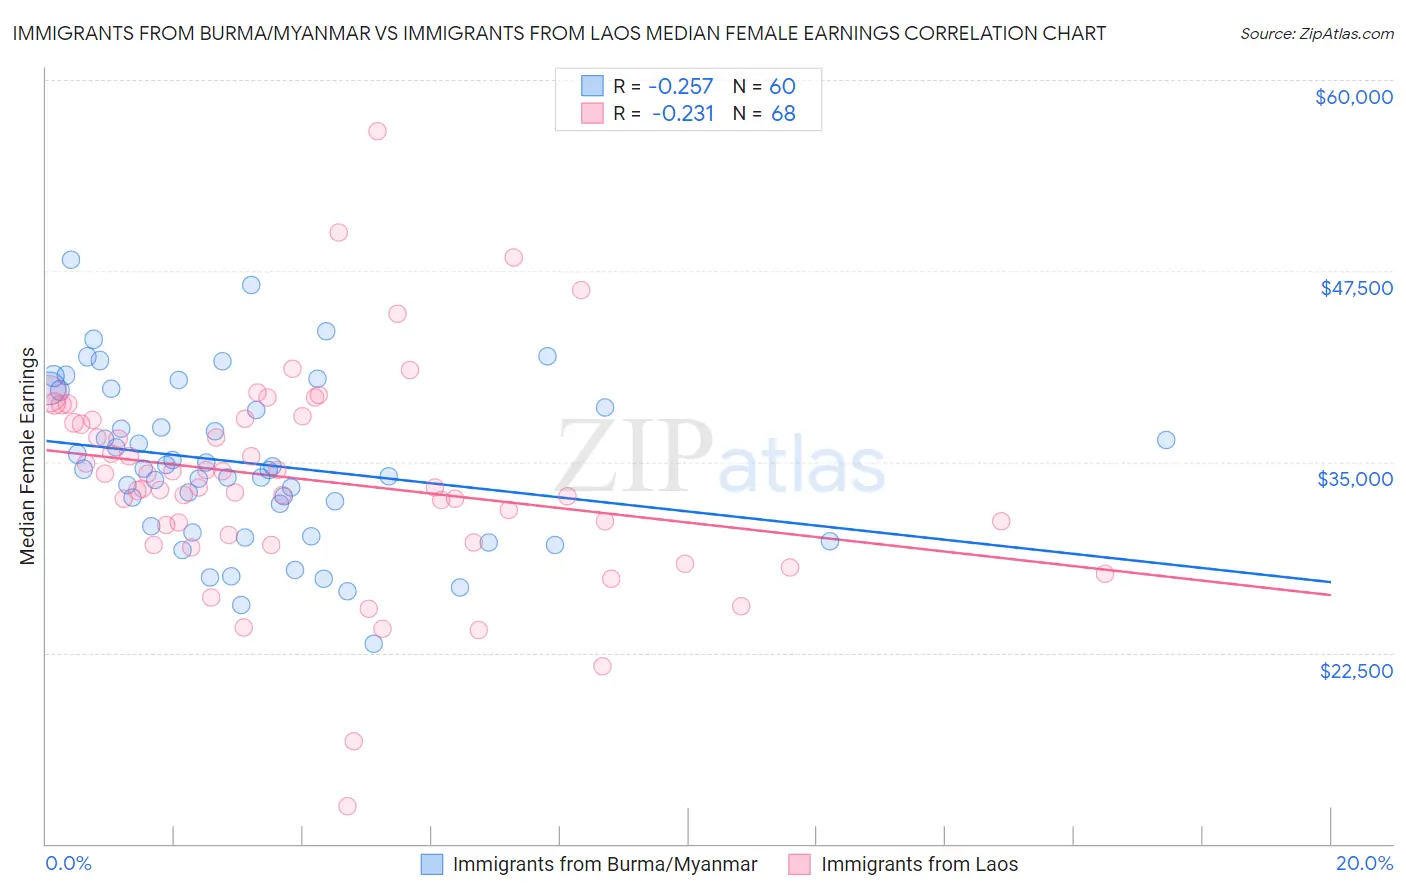
Immigrants from Burma/Myanmar vs Immigrants from Laos Median Female Earnings Correlation Chart
The statistical analysis conducted on geographies consisting of 172,347,432 people shows a weak negative correlation between the proportion of Immigrants from Burma/Myanmar and median female earnings in the United States with a correlation coefficient (R) of -0.257 and weighted average of $38,028. Similarly, the statistical analysis conducted on geographies consisting of 201,447,053 people shows a weak negative correlation between the proportion of Immigrants from Laos and median female earnings in the United States with a correlation coefficient (R) of -0.231 and weighted average of $36,841, a difference of 3.2%.
Median Female Earnings Correlation Summary
| Measurement | Immigrants from Burma/Myanmar | Immigrants from Laos |
| Minimum | $23,125 | $12,451 |
| Maximum | $48,239 | $56,635 |
| Range | $25,114 | $44,184 |
| Mean | $34,892 | $33,796 |
| Median | $34,545 | $33,308 |
| Interquartile 25% (IQ1) | $30,606 | $29,977 |
| Interquartile 75% (IQ3) | $39,132 | $37,781 |
| Interquartile Range (IQR) | $8,525 | $7,803 |
| Standard Deviation (Sample) | $5,366 | $7,087 |
| Standard Deviation (Population) | $5,321 | $7,035 |
Similar Demographics by Median Female Earnings
Demographics Similar to Immigrants from Burma/Myanmar by Median Female Earnings
In terms of median female earnings, the demographic groups most similar to Immigrants from Burma/Myanmar are German ($37,986, a difference of 0.11%), Immigrants from Liberia ($37,970, a difference of 0.15%), Immigrants from Middle Africa ($37,965, a difference of 0.17%), Delaware ($37,964, a difference of 0.17%), and Spanish ($38,098, a difference of 0.18%).
| Demographics | Rating | Rank | Median Female Earnings |
| Sudanese | 4.4 /100 | #235 | Tragic $38,215 |
| Liberians | 4.4 /100 | #236 | Tragic $38,215 |
| Immigrants | Cabo Verde | 4.3 /100 | #237 | Tragic $38,208 |
| Alaska Natives | 4.3 /100 | #238 | Tragic $38,202 |
| English | 4.2 /100 | #239 | Tragic $38,196 |
| Finns | 4.0 /100 | #240 | Tragic $38,173 |
| Spanish | 3.5 /100 | #241 | Tragic $38,098 |
| Immigrants | Burma/Myanmar | 3.0 /100 | #242 | Tragic $38,028 |
| Germans | 2.8 /100 | #243 | Tragic $37,986 |
| Immigrants | Liberia | 2.7 /100 | #244 | Tragic $37,970 |
| Immigrants | Middle Africa | 2.7 /100 | #245 | Tragic $37,965 |
| Delaware | 2.6 /100 | #246 | Tragic $37,964 |
| Immigrants | Somalia | 2.4 /100 | #247 | Tragic $37,914 |
| Alaskan Athabascans | 2.3 /100 | #248 | Tragic $37,905 |
| Swiss | 2.3 /100 | #249 | Tragic $37,904 |
Demographics Similar to Immigrants from Laos by Median Female Earnings
In terms of median female earnings, the demographic groups most similar to Immigrants from Laos are Immigrants from Dominican Republic ($36,857, a difference of 0.040%), Nicaraguan ($36,904, a difference of 0.17%), French American Indian ($36,920, a difference of 0.21%), Immigrants from Venezuela ($37,003, a difference of 0.44%), and Immigrants from El Salvador ($36,673, a difference of 0.46%).
| Demographics | Rating | Rank | Median Female Earnings |
| Dominicans | 0.4 /100 | #266 | Tragic $37,046 |
| Immigrants | Nonimmigrants | 0.4 /100 | #267 | Tragic $37,024 |
| Cree | 0.4 /100 | #268 | Tragic $37,018 |
| Immigrants | Venezuela | 0.4 /100 | #269 | Tragic $37,003 |
| French American Indians | 0.3 /100 | #270 | Tragic $36,920 |
| Nicaraguans | 0.3 /100 | #271 | Tragic $36,904 |
| Immigrants | Dominican Republic | 0.3 /100 | #272 | Tragic $36,857 |
| Immigrants | Laos | 0.3 /100 | #273 | Tragic $36,841 |
| Immigrants | El Salvador | 0.2 /100 | #274 | Tragic $36,673 |
| Africans | 0.1 /100 | #275 | Tragic $36,530 |
| Central Americans | 0.1 /100 | #276 | Tragic $36,492 |
| Marshallese | 0.1 /100 | #277 | Tragic $36,459 |
| U.S. Virgin Islanders | 0.1 /100 | #278 | Tragic $36,424 |
| Immigrants | Caribbean | 0.1 /100 | #279 | Tragic $36,414 |
| Iroquois | 0.1 /100 | #280 | Tragic $36,408 |