Immigrants from Burma/Myanmar vs Immigrants from Eastern Africa Median Female Earnings
COMPARE
Immigrants from Burma/Myanmar
Immigrants from Eastern Africa
Median Female Earnings
Median Female Earnings Comparison
Immigrants from Burma/Myanmar
Immigrants from Eastern Africa
$38,028
MEDIAN FEMALE EARNINGS
3.0/ 100
METRIC RATING
242nd/ 347
METRIC RANK
$40,644
MEDIAN FEMALE EARNINGS
87.7/ 100
METRIC RATING
136th/ 347
METRIC RANK
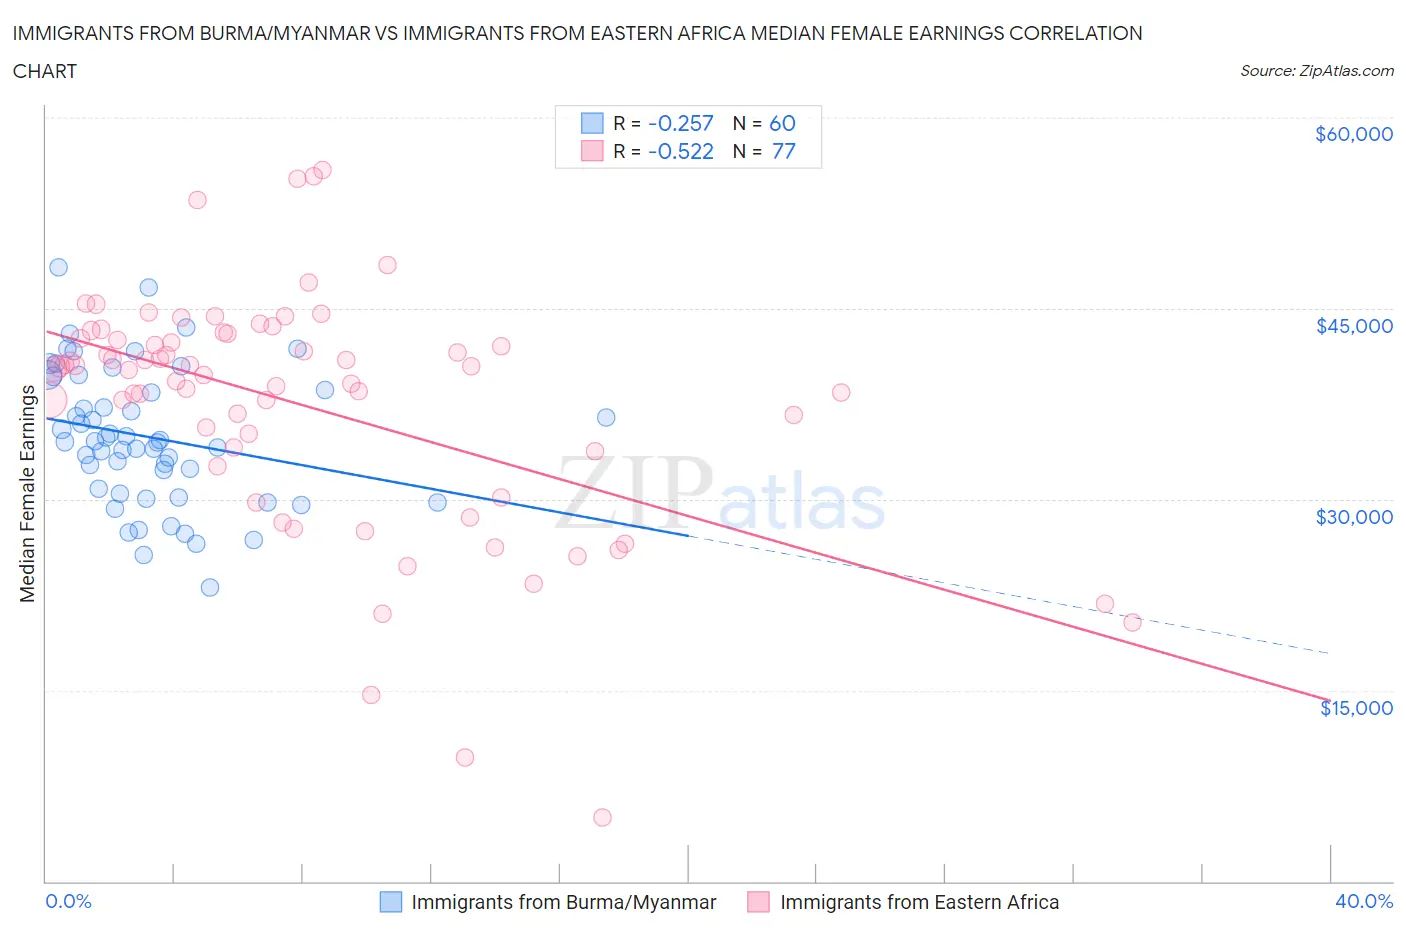
Immigrants from Burma/Myanmar vs Immigrants from Eastern Africa Median Female Earnings Correlation Chart
The statistical analysis conducted on geographies consisting of 172,347,432 people shows a weak negative correlation between the proportion of Immigrants from Burma/Myanmar and median female earnings in the United States with a correlation coefficient (R) of -0.257 and weighted average of $38,028. Similarly, the statistical analysis conducted on geographies consisting of 355,081,217 people shows a substantial negative correlation between the proportion of Immigrants from Eastern Africa and median female earnings in the United States with a correlation coefficient (R) of -0.522 and weighted average of $40,644, a difference of 6.9%.
Median Female Earnings Correlation Summary
| Measurement | Immigrants from Burma/Myanmar | Immigrants from Eastern Africa |
| Minimum | $23,125 | $5,000 |
| Maximum | $48,239 | $55,898 |
| Range | $25,114 | $50,898 |
| Mean | $34,892 | $37,373 |
| Median | $34,545 | $40,248 |
| Interquartile 25% (IQ1) | $30,606 | $33,197 |
| Interquartile 75% (IQ3) | $39,132 | $42,814 |
| Interquartile Range (IQR) | $8,525 | $9,617 |
| Standard Deviation (Sample) | $5,366 | $9,538 |
| Standard Deviation (Population) | $5,321 | $9,476 |
Similar Demographics by Median Female Earnings
Demographics Similar to Immigrants from Burma/Myanmar by Median Female Earnings
In terms of median female earnings, the demographic groups most similar to Immigrants from Burma/Myanmar are German ($37,986, a difference of 0.11%), Immigrants from Liberia ($37,970, a difference of 0.15%), Immigrants from Middle Africa ($37,965, a difference of 0.17%), Delaware ($37,964, a difference of 0.17%), and Spanish ($38,098, a difference of 0.18%).
| Demographics | Rating | Rank | Median Female Earnings |
| Sudanese | 4.4 /100 | #235 | Tragic $38,215 |
| Liberians | 4.4 /100 | #236 | Tragic $38,215 |
| Immigrants | Cabo Verde | 4.3 /100 | #237 | Tragic $38,208 |
| Alaska Natives | 4.3 /100 | #238 | Tragic $38,202 |
| English | 4.2 /100 | #239 | Tragic $38,196 |
| Finns | 4.0 /100 | #240 | Tragic $38,173 |
| Spanish | 3.5 /100 | #241 | Tragic $38,098 |
| Immigrants | Burma/Myanmar | 3.0 /100 | #242 | Tragic $38,028 |
| Germans | 2.8 /100 | #243 | Tragic $37,986 |
| Immigrants | Liberia | 2.7 /100 | #244 | Tragic $37,970 |
| Immigrants | Middle Africa | 2.7 /100 | #245 | Tragic $37,965 |
| Delaware | 2.6 /100 | #246 | Tragic $37,964 |
| Immigrants | Somalia | 2.4 /100 | #247 | Tragic $37,914 |
| Alaskan Athabascans | 2.3 /100 | #248 | Tragic $37,905 |
| Swiss | 2.3 /100 | #249 | Tragic $37,904 |
Demographics Similar to Immigrants from Eastern Africa by Median Female Earnings
In terms of median female earnings, the demographic groups most similar to Immigrants from Eastern Africa are Pakistani ($40,596, a difference of 0.12%), Immigrants from Nepal ($40,704, a difference of 0.15%), Taiwanese ($40,576, a difference of 0.17%), Arab ($40,718, a difference of 0.18%), and Syrian ($40,727, a difference of 0.20%).
| Demographics | Rating | Rank | Median Female Earnings |
| Zimbabweans | 90.8 /100 | #129 | Exceptional $40,798 |
| Immigrants | Guyana | 90.3 /100 | #130 | Exceptional $40,773 |
| Chileans | 90.0 /100 | #131 | Exceptional $40,757 |
| Immigrants | Uganda | 89.7 /100 | #132 | Excellent $40,739 |
| Syrians | 89.5 /100 | #133 | Excellent $40,727 |
| Arabs | 89.3 /100 | #134 | Excellent $40,718 |
| Immigrants | Nepal | 89.0 /100 | #135 | Excellent $40,704 |
| Immigrants | Eastern Africa | 87.7 /100 | #136 | Excellent $40,644 |
| Pakistanis | 86.6 /100 | #137 | Excellent $40,596 |
| Taiwanese | 86.1 /100 | #138 | Excellent $40,576 |
| Immigrants | South Eastern Asia | 85.7 /100 | #139 | Excellent $40,558 |
| Serbians | 85.2 /100 | #140 | Excellent $40,539 |
| Immigrants | Syria | 84.1 /100 | #141 | Excellent $40,499 |
| Sri Lankans | 84.0 /100 | #142 | Excellent $40,496 |
| Northern Europeans | 83.9 /100 | #143 | Excellent $40,491 |