Nepalese vs Immigrants from Guyana Median Female Earnings
COMPARE
Nepalese
Immigrants from Guyana
Median Female Earnings
Median Female Earnings Comparison
Nepalese
Immigrants from Guyana
$38,603
MEDIAN FEMALE EARNINGS
9.3/ 100
METRIC RATING
219th/ 347
METRIC RANK
$40,773
MEDIAN FEMALE EARNINGS
90.3/ 100
METRIC RATING
130th/ 347
METRIC RANK
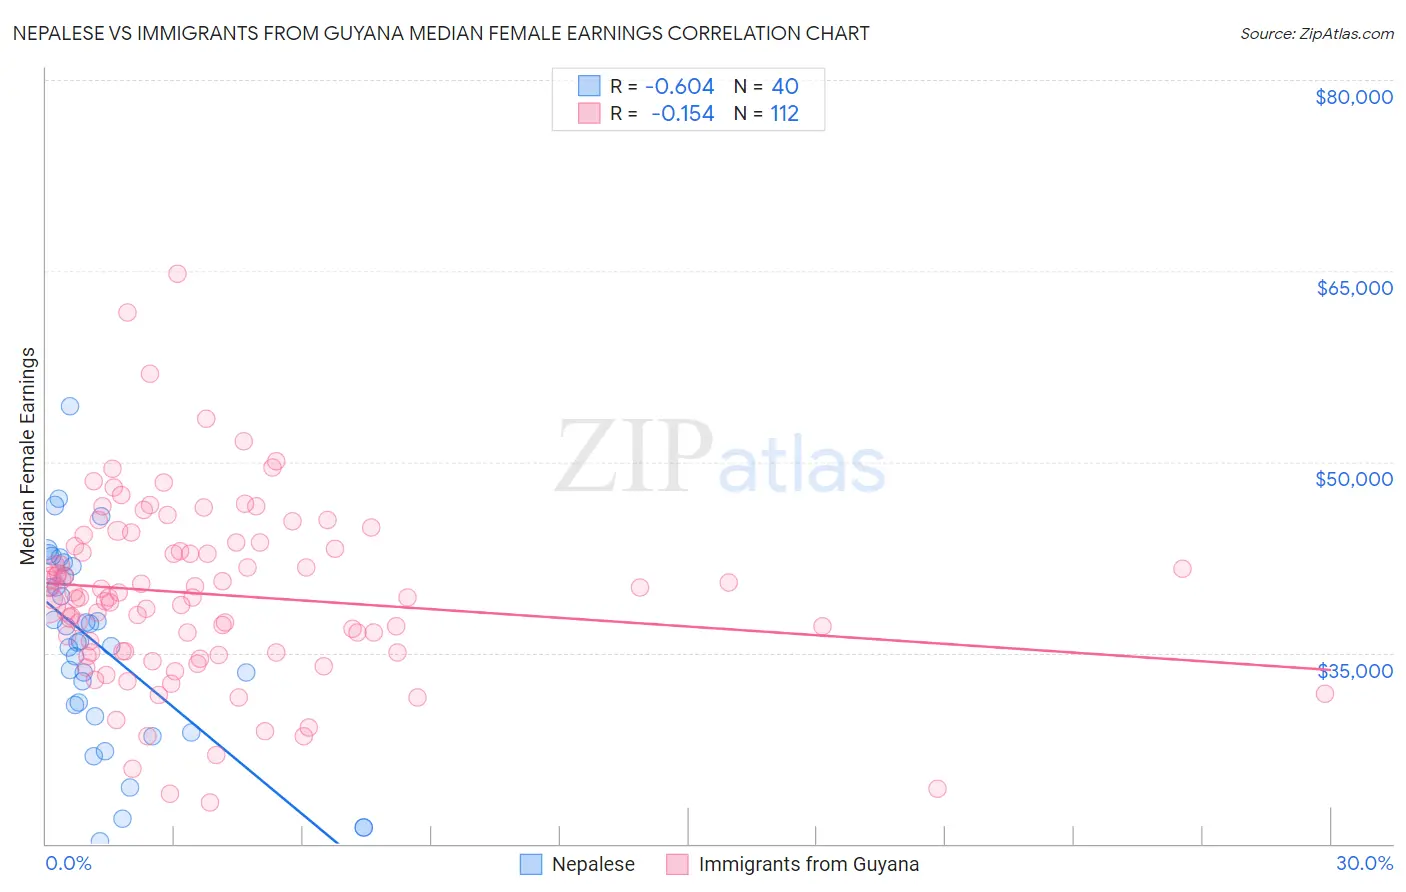
Nepalese vs Immigrants from Guyana Median Female Earnings Correlation Chart
The statistical analysis conducted on geographies consisting of 24,521,755 people shows a significant negative correlation between the proportion of Nepalese and median female earnings in the United States with a correlation coefficient (R) of -0.604 and weighted average of $38,603. Similarly, the statistical analysis conducted on geographies consisting of 183,689,123 people shows a poor negative correlation between the proportion of Immigrants from Guyana and median female earnings in the United States with a correlation coefficient (R) of -0.154 and weighted average of $40,773, a difference of 5.6%.
Median Female Earnings Correlation Summary
| Measurement | Nepalese | Immigrants from Guyana |
| Minimum | $20,210 | $23,277 |
| Maximum | $54,407 | $64,779 |
| Range | $34,197 | $41,502 |
| Mean | $35,483 | $39,583 |
| Median | $35,860 | $39,337 |
| Interquartile 25% (IQ1) | $30,426 | $35,009 |
| Interquartile 75% (IQ3) | $41,423 | $43,513 |
| Interquartile Range (IQR) | $10,997 | $8,503 |
| Standard Deviation (Sample) | $7,837 | $7,079 |
| Standard Deviation (Population) | $7,738 | $7,048 |
Similar Demographics by Median Female Earnings
Demographics Similar to Nepalese by Median Female Earnings
In terms of median female earnings, the demographic groups most similar to Nepalese are Cape Verdean ($38,614, a difference of 0.030%), Immigrants from Jamaica ($38,625, a difference of 0.060%), Yugoslavian ($38,573, a difference of 0.080%), Immigrants from the Azores ($38,573, a difference of 0.080%), and Immigrants from Ecuador ($38,644, a difference of 0.11%).
| Demographics | Rating | Rank | Median Female Earnings |
| Guamanians/Chamorros | 11.5 /100 | #212 | Poor $38,717 |
| Jamaicans | 10.5 /100 | #213 | Poor $38,670 |
| Iraqis | 10.5 /100 | #214 | Poor $38,666 |
| Spaniards | 10.3 /100 | #215 | Poor $38,656 |
| Immigrants | Ecuador | 10.1 /100 | #216 | Poor $38,644 |
| Immigrants | Jamaica | 9.7 /100 | #217 | Tragic $38,625 |
| Cape Verdeans | 9.5 /100 | #218 | Tragic $38,614 |
| Nepalese | 9.3 /100 | #219 | Tragic $38,603 |
| Yugoslavians | 8.8 /100 | #220 | Tragic $38,573 |
| Immigrants | Azores | 8.8 /100 | #221 | Tragic $38,573 |
| Japanese | 8.1 /100 | #222 | Tragic $38,528 |
| Immigrants | Sudan | 7.8 /100 | #223 | Tragic $38,511 |
| Native Hawaiians | 7.1 /100 | #224 | Tragic $38,461 |
| French | 7.0 /100 | #225 | Tragic $38,457 |
| French Canadians | 6.8 /100 | #226 | Tragic $38,436 |
Demographics Similar to Immigrants from Guyana by Median Female Earnings
In terms of median female earnings, the demographic groups most similar to Immigrants from Guyana are Chilean ($40,757, a difference of 0.040%), Zimbabwean ($40,798, a difference of 0.060%), Immigrants from Uganda ($40,739, a difference of 0.080%), Syrian ($40,727, a difference of 0.11%), and Carpatho Rusyn ($40,825, a difference of 0.13%).
| Demographics | Rating | Rank | Median Female Earnings |
| Guyanese | 93.4 /100 | #123 | Exceptional $40,973 |
| Trinidadians and Tobagonians | 93.2 /100 | #124 | Exceptional $40,958 |
| Austrians | 92.7 /100 | #125 | Exceptional $40,923 |
| Immigrants | Trinidad and Tobago | 92.3 /100 | #126 | Exceptional $40,895 |
| Ugandans | 92.2 /100 | #127 | Exceptional $40,889 |
| Carpatho Rusyns | 91.2 /100 | #128 | Exceptional $40,825 |
| Zimbabweans | 90.8 /100 | #129 | Exceptional $40,798 |
| Immigrants | Guyana | 90.3 /100 | #130 | Exceptional $40,773 |
| Chileans | 90.0 /100 | #131 | Exceptional $40,757 |
| Immigrants | Uganda | 89.7 /100 | #132 | Excellent $40,739 |
| Syrians | 89.5 /100 | #133 | Excellent $40,727 |
| Arabs | 89.3 /100 | #134 | Excellent $40,718 |
| Immigrants | Nepal | 89.0 /100 | #135 | Excellent $40,704 |
| Immigrants | Eastern Africa | 87.7 /100 | #136 | Excellent $40,644 |
| Pakistanis | 86.6 /100 | #137 | Excellent $40,596 |