Honduran vs Immigrants from Austria Median Family Income
COMPARE
Honduran
Immigrants from Austria
Median Family Income
Median Family Income Comparison
Hondurans
Immigrants from Austria
$85,004
MEDIAN FAMILY INCOME
0.0/ 100
METRIC RATING
311th/ 347
METRIC RANK
$116,830
MEDIAN FAMILY INCOME
99.9/ 100
METRIC RATING
47th/ 347
METRIC RANK
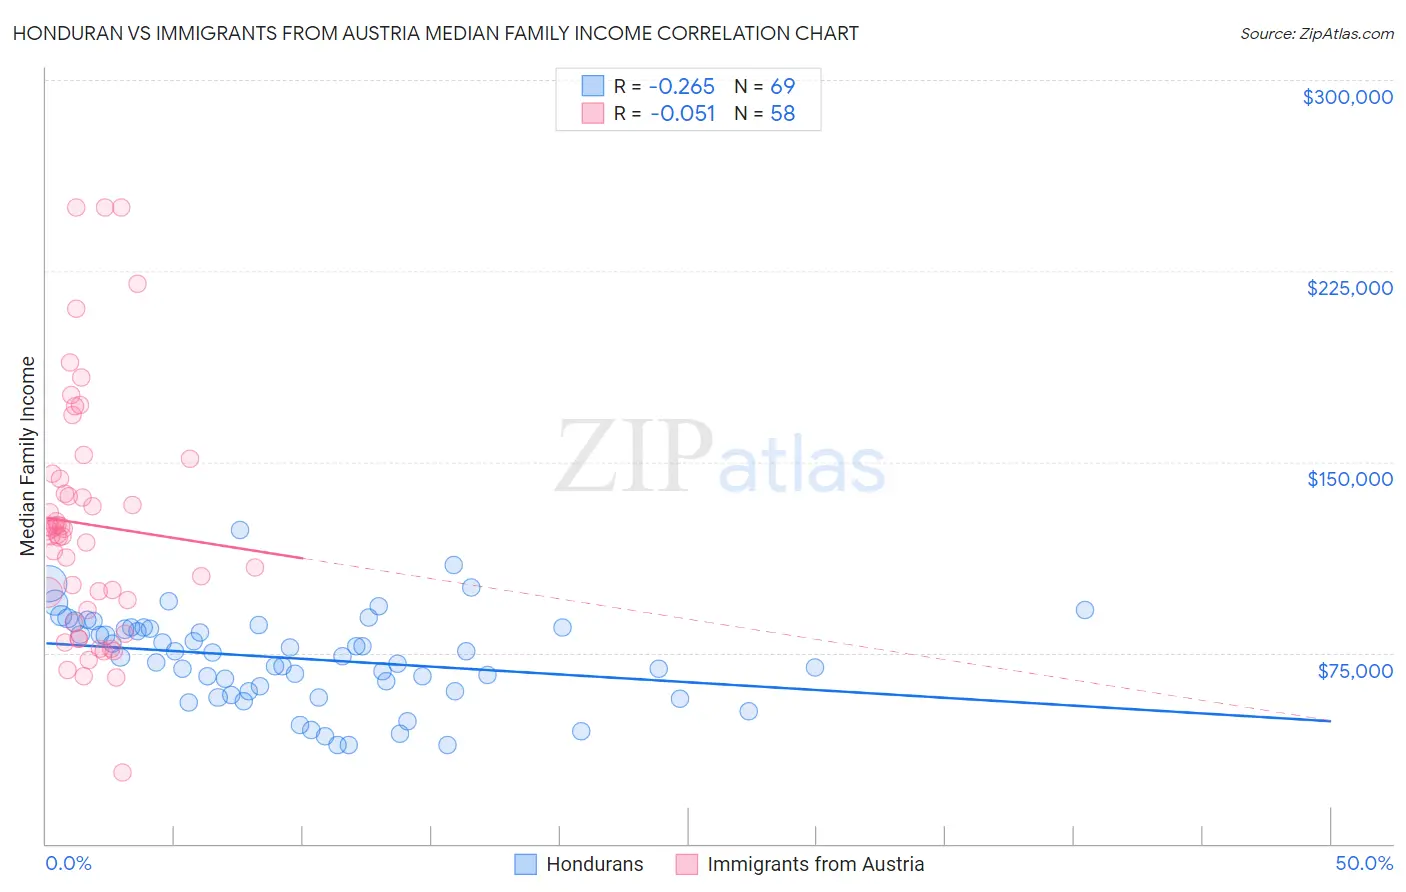
Honduran vs Immigrants from Austria Median Family Income Correlation Chart
The statistical analysis conducted on geographies consisting of 357,506,155 people shows a weak negative correlation between the proportion of Hondurans and median family income in the United States with a correlation coefficient (R) of -0.265 and weighted average of $85,004. Similarly, the statistical analysis conducted on geographies consisting of 167,957,927 people shows a slight negative correlation between the proportion of Immigrants from Austria and median family income in the United States with a correlation coefficient (R) of -0.051 and weighted average of $116,830, a difference of 37.4%.
Median Family Income Correlation Summary
| Measurement | Honduran | Immigrants from Austria |
| Minimum | $38,552 | $28,077 |
| Maximum | $123,311 | $250,001 |
| Range | $84,759 | $221,924 |
| Mean | $72,692 | $125,494 |
| Median | $73,540 | $122,176 |
| Interquartile 25% (IQ1) | $59,714 | $91,605 |
| Interquartile 75% (IQ3) | $84,854 | $143,362 |
| Interquartile Range (IQR) | $25,140 | $51,756 |
| Standard Deviation (Sample) | $17,679 | $47,633 |
| Standard Deviation (Population) | $17,550 | $47,221 |
Similar Demographics by Median Family Income
Demographics Similar to Hondurans by Median Family Income
In terms of median family income, the demographic groups most similar to Hondurans are Cuban ($84,981, a difference of 0.030%), Immigrants from Central America ($85,050, a difference of 0.050%), Choctaw ($84,835, a difference of 0.20%), Haitian ($85,218, a difference of 0.25%), and Immigrants from Bahamas ($84,732, a difference of 0.32%).
| Demographics | Rating | Rank | Median Family Income |
| Mexicans | 0.0 /100 | #304 | Tragic $85,618 |
| Paiute | 0.0 /100 | #305 | Tragic $85,414 |
| Immigrants | Dominica | 0.0 /100 | #306 | Tragic $85,411 |
| Chickasaw | 0.0 /100 | #307 | Tragic $85,356 |
| U.S. Virgin Islanders | 0.0 /100 | #308 | Tragic $85,294 |
| Haitians | 0.0 /100 | #309 | Tragic $85,218 |
| Immigrants | Central America | 0.0 /100 | #310 | Tragic $85,050 |
| Hondurans | 0.0 /100 | #311 | Tragic $85,004 |
| Cubans | 0.0 /100 | #312 | Tragic $84,981 |
| Choctaw | 0.0 /100 | #313 | Tragic $84,835 |
| Immigrants | Bahamas | 0.0 /100 | #314 | Tragic $84,732 |
| Apache | 0.0 /100 | #315 | Tragic $84,451 |
| Immigrants | Haiti | 0.0 /100 | #316 | Tragic $84,018 |
| Yakama | 0.0 /100 | #317 | Tragic $83,932 |
| Immigrants | Mexico | 0.0 /100 | #318 | Tragic $83,639 |
Demographics Similar to Immigrants from Austria by Median Family Income
In terms of median family income, the demographic groups most similar to Immigrants from Austria are Immigrants from Russia ($116,942, a difference of 0.10%), Immigrants from Greece ($117,344, a difference of 0.44%), Immigrants from South Africa ($116,286, a difference of 0.47%), Chinese ($116,188, a difference of 0.55%), and Immigrants from Czechoslovakia ($116,165, a difference of 0.57%).
| Demographics | Rating | Rank | Median Family Income |
| Immigrants | Lithuania | 100.0 /100 | #40 | Exceptional $118,053 |
| Estonians | 100.0 /100 | #41 | Exceptional $118,013 |
| Immigrants | Bolivia | 100.0 /100 | #42 | Exceptional $117,912 |
| Bulgarians | 100.0 /100 | #43 | Exceptional $117,818 |
| Cambodians | 100.0 /100 | #44 | Exceptional $117,780 |
| Immigrants | Greece | 99.9 /100 | #45 | Exceptional $117,344 |
| Immigrants | Russia | 99.9 /100 | #46 | Exceptional $116,942 |
| Immigrants | Austria | 99.9 /100 | #47 | Exceptional $116,830 |
| Immigrants | South Africa | 99.9 /100 | #48 | Exceptional $116,286 |
| Chinese | 99.9 /100 | #49 | Exceptional $116,188 |
| Immigrants | Czechoslovakia | 99.9 /100 | #50 | Exceptional $116,165 |
| Immigrants | Malaysia | 99.9 /100 | #51 | Exceptional $115,880 |
| Maltese | 99.9 /100 | #52 | Exceptional $115,862 |
| Immigrants | Norway | 99.9 /100 | #53 | Exceptional $115,847 |
| Immigrants | Europe | 99.9 /100 | #54 | Exceptional $115,523 |