Hmong vs Immigrants from Ethiopia Per Capita Income
COMPARE
Hmong
Immigrants from Ethiopia
Per Capita Income
Per Capita Income Comparison
Hmong
Immigrants from Ethiopia
$38,120
PER CAPITA INCOME
0.2/ 100
METRIC RATING
276th/ 347
METRIC RANK
$45,923
PER CAPITA INCOME
92.7/ 100
METRIC RATING
120th/ 347
METRIC RANK
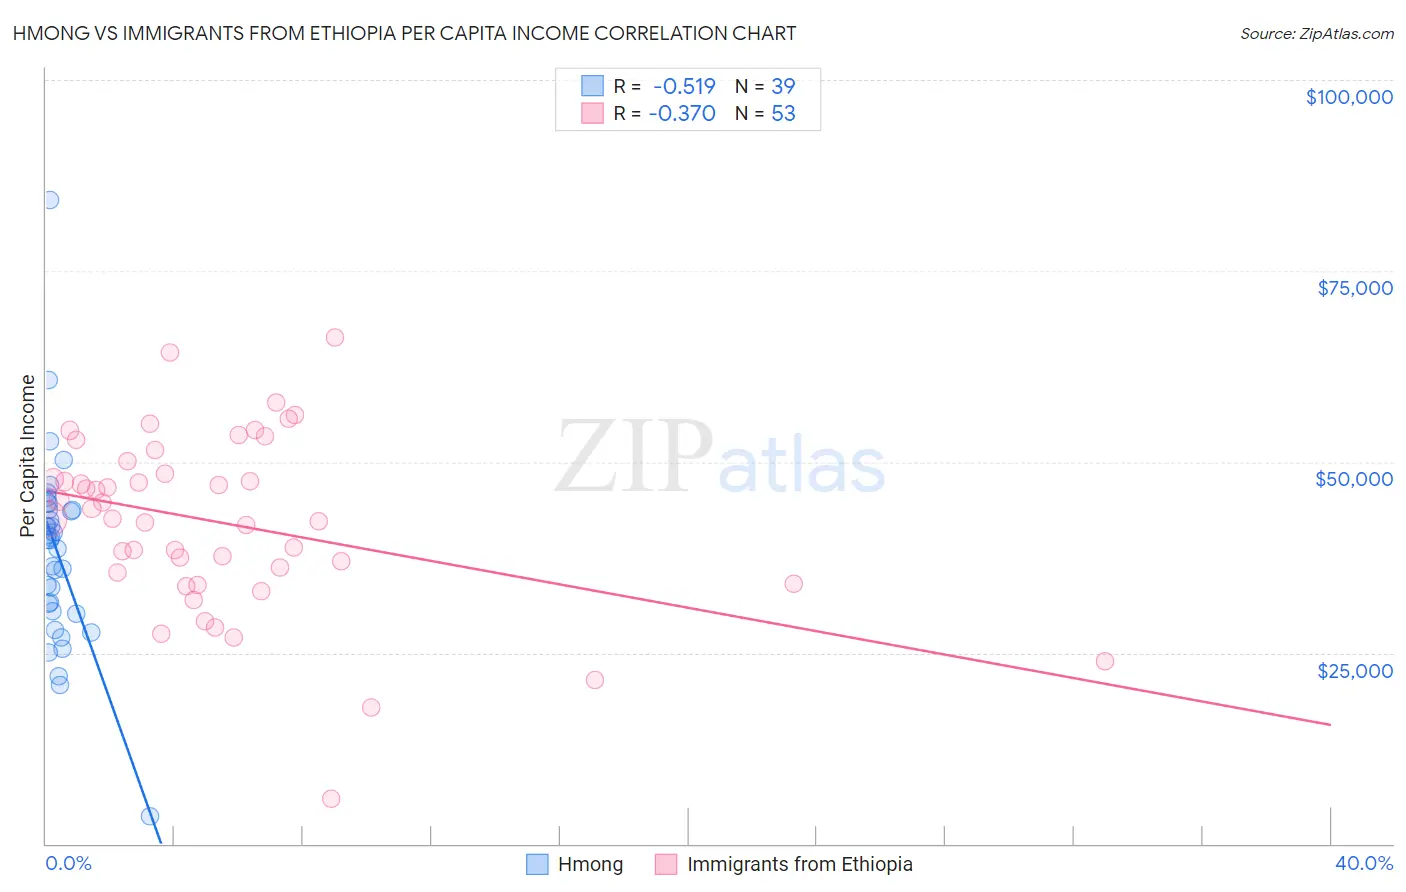
Hmong vs Immigrants from Ethiopia Per Capita Income Correlation Chart
The statistical analysis conducted on geographies consisting of 24,672,334 people shows a substantial negative correlation between the proportion of Hmong and per capita income in the United States with a correlation coefficient (R) of -0.519 and weighted average of $38,120. Similarly, the statistical analysis conducted on geographies consisting of 211,574,891 people shows a mild negative correlation between the proportion of Immigrants from Ethiopia and per capita income in the United States with a correlation coefficient (R) of -0.370 and weighted average of $45,923, a difference of 20.5%.
Per Capita Income Correlation Summary
| Measurement | Hmong | Immigrants from Ethiopia |
| Minimum | $3,563 | $5,866 |
| Maximum | $84,315 | $66,352 |
| Range | $80,752 | $60,486 |
| Mean | $38,244 | $42,004 |
| Median | $39,777 | $42,502 |
| Interquartile 25% (IQ1) | $30,464 | $34,771 |
| Interquartile 75% (IQ3) | $43,732 | $49,297 |
| Interquartile Range (IQR) | $13,268 | $14,526 |
| Standard Deviation (Sample) | $12,703 | $11,622 |
| Standard Deviation (Population) | $12,539 | $11,512 |
Similar Demographics by Per Capita Income
Demographics Similar to Hmong by Per Capita Income
In terms of per capita income, the demographic groups most similar to Hmong are Comanche ($38,088, a difference of 0.080%), Immigrants from Liberia ($38,165, a difference of 0.12%), Immigrants from Nicaragua ($38,065, a difference of 0.15%), Colville ($38,047, a difference of 0.19%), and Potawatomi ($38,046, a difference of 0.20%).
| Demographics | Rating | Rank | Per Capita Income |
| Immigrants | Jamaica | 0.4 /100 | #269 | Tragic $38,766 |
| Immigrants | Belize | 0.3 /100 | #270 | Tragic $38,614 |
| Central Americans | 0.3 /100 | #271 | Tragic $38,560 |
| Immigrants | Cabo Verde | 0.3 /100 | #272 | Tragic $38,540 |
| Nepalese | 0.3 /100 | #273 | Tragic $38,442 |
| Immigrants | El Salvador | 0.3 /100 | #274 | Tragic $38,394 |
| Immigrants | Liberia | 0.2 /100 | #275 | Tragic $38,165 |
| Hmong | 0.2 /100 | #276 | Tragic $38,120 |
| Comanche | 0.2 /100 | #277 | Tragic $38,088 |
| Immigrants | Nicaragua | 0.2 /100 | #278 | Tragic $38,065 |
| Colville | 0.2 /100 | #279 | Tragic $38,047 |
| Potawatomi | 0.2 /100 | #280 | Tragic $38,046 |
| Immigrants | Dominica | 0.2 /100 | #281 | Tragic $37,952 |
| Immigrants | Laos | 0.1 /100 | #282 | Tragic $37,857 |
| Pennsylvania Germans | 0.1 /100 | #283 | Tragic $37,842 |
Demographics Similar to Immigrants from Ethiopia by Per Capita Income
In terms of per capita income, the demographic groups most similar to Immigrants from Ethiopia are Immigrants from Poland ($45,979, a difference of 0.12%), Canadian ($45,858, a difference of 0.14%), Moroccan ($45,854, a difference of 0.15%), Lebanese ($45,840, a difference of 0.18%), and Immigrants from Saudi Arabia ($46,008, a difference of 0.19%).
| Demographics | Rating | Rank | Per Capita Income |
| Immigrants | Albania | 95.5 /100 | #113 | Exceptional $46,387 |
| Afghans | 94.9 /100 | #114 | Exceptional $46,268 |
| Immigrants | Chile | 94.6 /100 | #115 | Exceptional $46,213 |
| Poles | 94.1 /100 | #116 | Exceptional $46,123 |
| Chinese | 93.9 /100 | #117 | Exceptional $46,098 |
| Immigrants | Saudi Arabia | 93.3 /100 | #118 | Exceptional $46,008 |
| Immigrants | Poland | 93.1 /100 | #119 | Exceptional $45,979 |
| Immigrants | Ethiopia | 92.7 /100 | #120 | Exceptional $45,923 |
| Canadians | 92.2 /100 | #121 | Exceptional $45,858 |
| Moroccans | 92.1 /100 | #122 | Exceptional $45,854 |
| Lebanese | 92.0 /100 | #123 | Exceptional $45,840 |
| Europeans | 92.0 /100 | #124 | Exceptional $45,836 |
| Zimbabweans | 91.7 /100 | #125 | Exceptional $45,804 |
| Palestinians | 91.6 /100 | #126 | Exceptional $45,790 |
| Immigrants | Germany | 91.3 /100 | #127 | Exceptional $45,751 |