Hmong vs Immigrants from El Salvador Per Capita Income
COMPARE
Hmong
Immigrants from El Salvador
Per Capita Income
Per Capita Income Comparison
Hmong
Immigrants from El Salvador
$38,120
PER CAPITA INCOME
0.2/ 100
METRIC RATING
276th/ 347
METRIC RANK
$38,394
PER CAPITA INCOME
0.3/ 100
METRIC RATING
274th/ 347
METRIC RANK
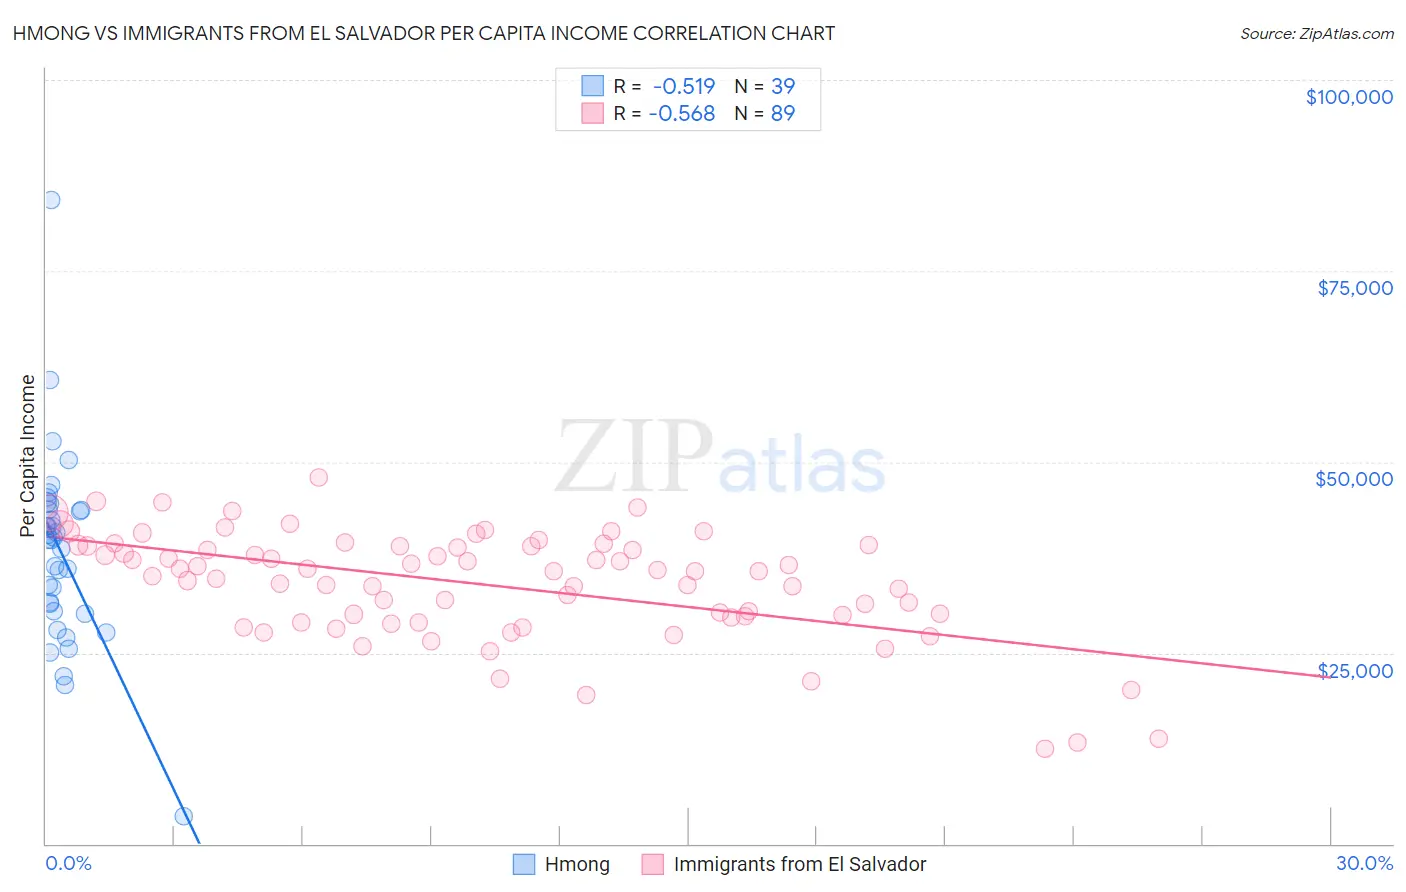
Hmong vs Immigrants from El Salvador Per Capita Income Correlation Chart
The statistical analysis conducted on geographies consisting of 24,672,334 people shows a substantial negative correlation between the proportion of Hmong and per capita income in the United States with a correlation coefficient (R) of -0.519 and weighted average of $38,120. Similarly, the statistical analysis conducted on geographies consisting of 357,847,435 people shows a substantial negative correlation between the proportion of Immigrants from El Salvador and per capita income in the United States with a correlation coefficient (R) of -0.568 and weighted average of $38,394, a difference of 0.72%.
Per Capita Income Correlation Summary
| Measurement | Hmong | Immigrants from El Salvador |
| Minimum | $3,563 | $12,473 |
| Maximum | $84,315 | $47,918 |
| Range | $80,752 | $35,445 |
| Mean | $38,244 | $33,959 |
| Median | $39,777 | $35,640 |
| Interquartile 25% (IQ1) | $30,464 | $29,770 |
| Interquartile 75% (IQ3) | $43,732 | $39,011 |
| Interquartile Range (IQR) | $13,268 | $9,240 |
| Standard Deviation (Sample) | $12,703 | $7,077 |
| Standard Deviation (Population) | $12,539 | $7,037 |
Demographics Similar to Hmong and Immigrants from El Salvador by Per Capita Income
In terms of per capita income, the demographic groups most similar to Hmong are Comanche ($38,088, a difference of 0.080%), Immigrants from Liberia ($38,165, a difference of 0.12%), Immigrants from Nicaragua ($38,065, a difference of 0.15%), Colville ($38,047, a difference of 0.19%), and Potawatomi ($38,046, a difference of 0.20%). Similarly, the demographic groups most similar to Immigrants from El Salvador are Nepalese ($38,442, a difference of 0.13%), Immigrants from Cabo Verde ($38,540, a difference of 0.38%), Central American ($38,560, a difference of 0.43%), Immigrants from Belize ($38,614, a difference of 0.57%), and Immigrants from Liberia ($38,165, a difference of 0.60%).
| Demographics | Rating | Rank | Per Capita Income |
| Spanish Americans | 0.5 /100 | #265 | Tragic $39,012 |
| Salvadorans | 0.5 /100 | #266 | Tragic $38,858 |
| Immigrants | Zaire | 0.4 /100 | #267 | Tragic $38,848 |
| Liberians | 0.4 /100 | #268 | Tragic $38,780 |
| Immigrants | Jamaica | 0.4 /100 | #269 | Tragic $38,766 |
| Immigrants | Belize | 0.3 /100 | #270 | Tragic $38,614 |
| Central Americans | 0.3 /100 | #271 | Tragic $38,560 |
| Immigrants | Cabo Verde | 0.3 /100 | #272 | Tragic $38,540 |
| Nepalese | 0.3 /100 | #273 | Tragic $38,442 |
| Immigrants | El Salvador | 0.3 /100 | #274 | Tragic $38,394 |
| Immigrants | Liberia | 0.2 /100 | #275 | Tragic $38,165 |
| Hmong | 0.2 /100 | #276 | Tragic $38,120 |
| Comanche | 0.2 /100 | #277 | Tragic $38,088 |
| Immigrants | Nicaragua | 0.2 /100 | #278 | Tragic $38,065 |
| Colville | 0.2 /100 | #279 | Tragic $38,047 |
| Potawatomi | 0.2 /100 | #280 | Tragic $38,046 |
| Immigrants | Dominica | 0.2 /100 | #281 | Tragic $37,952 |
| Immigrants | Laos | 0.1 /100 | #282 | Tragic $37,857 |
| Pennsylvania Germans | 0.1 /100 | #283 | Tragic $37,842 |
| Africans | 0.1 /100 | #284 | Tragic $37,785 |
| Guatemalans | 0.1 /100 | #285 | Tragic $37,766 |