Haitian vs Immigrants from Sweden Median Female Earnings
COMPARE
Haitian
Immigrants from Sweden
Median Female Earnings
Median Female Earnings Comparison
Haitians
Immigrants from Sweden
$36,374
MEDIAN FEMALE EARNINGS
0.1/ 100
METRIC RATING
282nd/ 347
METRIC RANK
$44,774
MEDIAN FEMALE EARNINGS
100.0/ 100
METRIC RATING
25th/ 347
METRIC RANK
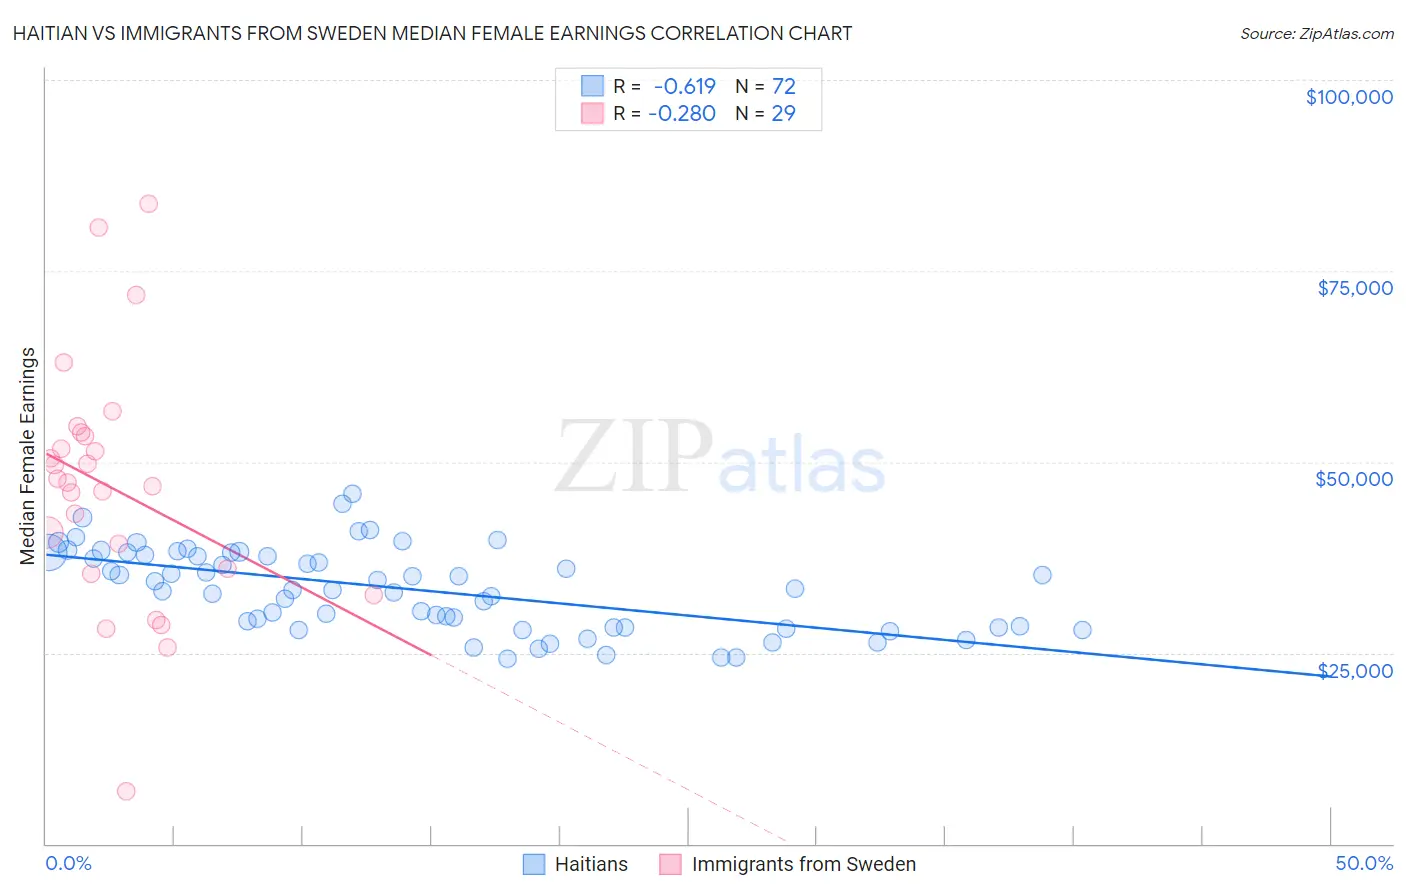
Haitian vs Immigrants from Sweden Median Female Earnings Correlation Chart
The statistical analysis conducted on geographies consisting of 287,899,387 people shows a significant negative correlation between the proportion of Haitians and median female earnings in the United States with a correlation coefficient (R) of -0.619 and weighted average of $36,374. Similarly, the statistical analysis conducted on geographies consisting of 164,714,291 people shows a weak negative correlation between the proportion of Immigrants from Sweden and median female earnings in the United States with a correlation coefficient (R) of -0.280 and weighted average of $44,774, a difference of 23.1%.
Median Female Earnings Correlation Summary
| Measurement | Haitian | Immigrants from Sweden |
| Minimum | $24,245 | $6,800 |
| Maximum | $45,799 | $83,727 |
| Range | $21,554 | $76,927 |
| Mean | $33,333 | $46,568 |
| Median | $33,334 | $47,333 |
| Interquartile 25% (IQ1) | $28,287 | $35,642 |
| Interquartile 75% (IQ3) | $37,934 | $53,626 |
| Interquartile Range (IQR) | $9,647 | $17,985 |
| Standard Deviation (Sample) | $5,376 | $16,157 |
| Standard Deviation (Population) | $5,339 | $15,876 |
Similar Demographics by Median Female Earnings
Demographics Similar to Haitians by Median Female Earnings
In terms of median female earnings, the demographic groups most similar to Haitians are Spanish American ($36,391, a difference of 0.050%), Iroquois ($36,408, a difference of 0.090%), Immigrants from Caribbean ($36,414, a difference of 0.11%), U.S. Virgin Islander ($36,424, a difference of 0.14%), and Marshallese ($36,459, a difference of 0.24%).
| Demographics | Rating | Rank | Median Female Earnings |
| Africans | 0.1 /100 | #275 | Tragic $36,530 |
| Central Americans | 0.1 /100 | #276 | Tragic $36,492 |
| Marshallese | 0.1 /100 | #277 | Tragic $36,459 |
| U.S. Virgin Islanders | 0.1 /100 | #278 | Tragic $36,424 |
| Immigrants | Caribbean | 0.1 /100 | #279 | Tragic $36,414 |
| Iroquois | 0.1 /100 | #280 | Tragic $36,408 |
| Spanish Americans | 0.1 /100 | #281 | Tragic $36,391 |
| Haitians | 0.1 /100 | #282 | Tragic $36,374 |
| Immigrants | Haiti | 0.1 /100 | #283 | Tragic $36,203 |
| Indonesians | 0.1 /100 | #284 | Tragic $36,140 |
| Paiute | 0.1 /100 | #285 | Tragic $36,056 |
| Osage | 0.0 /100 | #286 | Tragic $36,034 |
| Immigrants | Nicaragua | 0.0 /100 | #287 | Tragic $36,023 |
| Immigrants | Zaire | 0.0 /100 | #288 | Tragic $36,017 |
| Bangladeshis | 0.0 /100 | #289 | Tragic $35,960 |
Demographics Similar to Immigrants from Sweden by Median Female Earnings
In terms of median female earnings, the demographic groups most similar to Immigrants from Sweden are Immigrants from Belarus ($44,757, a difference of 0.040%), Immigrants from Korea ($44,847, a difference of 0.16%), Turkish ($44,695, a difference of 0.18%), Immigrants from Russia ($44,680, a difference of 0.21%), and Burmese ($44,911, a difference of 0.31%).
| Demographics | Rating | Rank | Median Female Earnings |
| Cypriots | 100.0 /100 | #18 | Exceptional $45,570 |
| Eastern Europeans | 100.0 /100 | #19 | Exceptional $45,385 |
| Immigrants | Japan | 100.0 /100 | #20 | Exceptional $45,323 |
| Cambodians | 100.0 /100 | #21 | Exceptional $45,014 |
| Immigrants | Greece | 100.0 /100 | #22 | Exceptional $44,976 |
| Burmese | 100.0 /100 | #23 | Exceptional $44,911 |
| Immigrants | Korea | 100.0 /100 | #24 | Exceptional $44,847 |
| Immigrants | Sweden | 100.0 /100 | #25 | Exceptional $44,774 |
| Immigrants | Belarus | 100.0 /100 | #26 | Exceptional $44,757 |
| Turks | 100.0 /100 | #27 | Exceptional $44,695 |
| Immigrants | Russia | 100.0 /100 | #28 | Exceptional $44,680 |
| Immigrants | Belgium | 100.0 /100 | #29 | Exceptional $44,587 |
| Asians | 100.0 /100 | #30 | Exceptional $44,586 |
| Immigrants | France | 100.0 /100 | #31 | Exceptional $44,541 |
| Immigrants | Northern Europe | 100.0 /100 | #32 | Exceptional $44,366 |