Haitian vs Immigrants from Sweden Single Mother Poverty
COMPARE
Haitian
Immigrants from Sweden
Single Mother Poverty
Single Mother Poverty Comparison
Haitians
Immigrants from Sweden
29.8%
SINGLE MOTHER POVERTY
13.3/ 100
METRIC RATING
210th/ 347
METRIC RANK
27.5%
SINGLE MOTHER POVERTY
99.2/ 100
METRIC RATING
75th/ 347
METRIC RANK
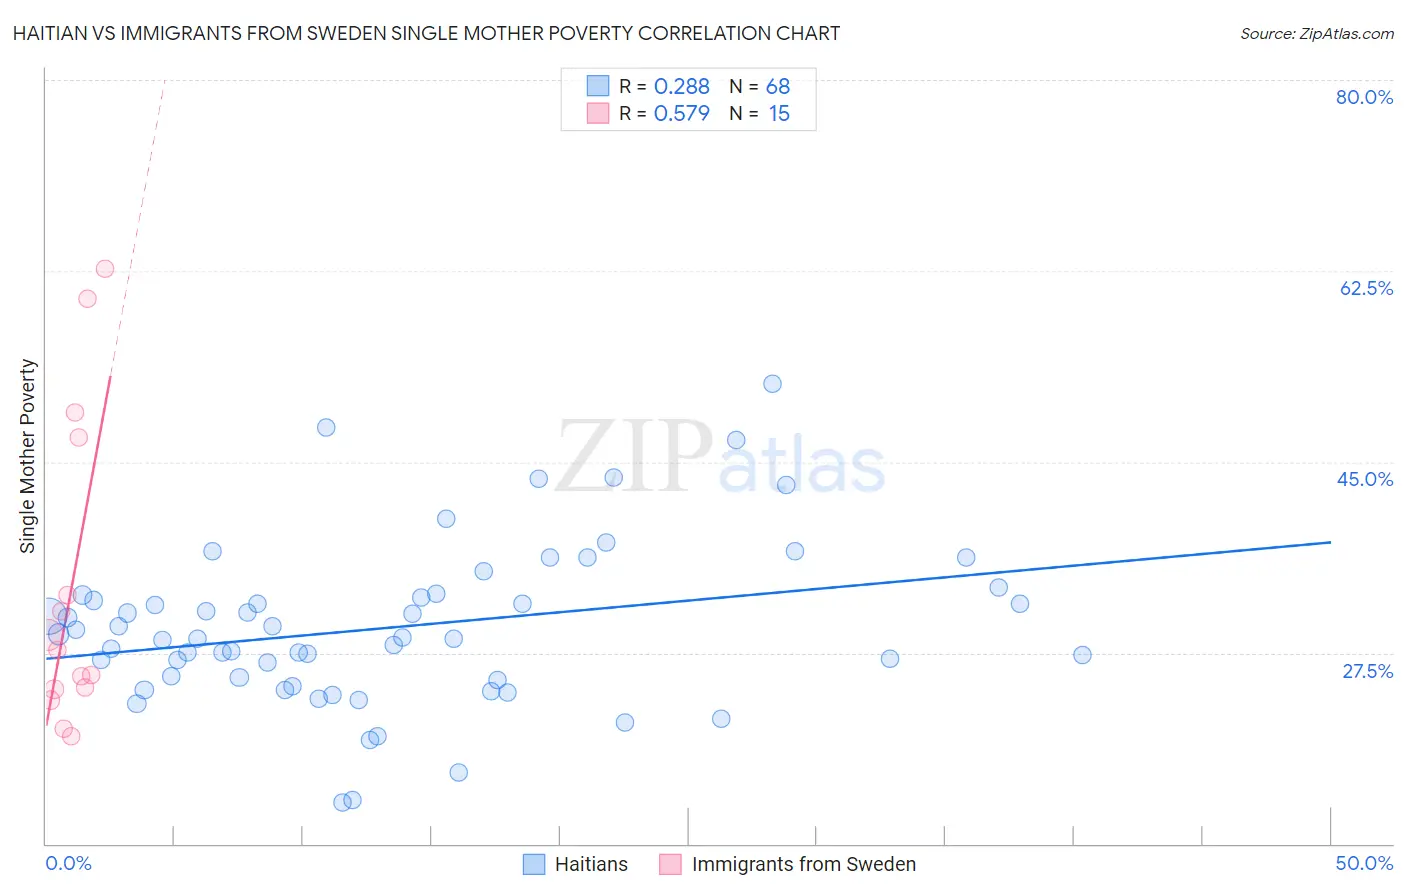
Haitian vs Immigrants from Sweden Single Mother Poverty Correlation Chart
The statistical analysis conducted on geographies consisting of 283,035,153 people shows a weak positive correlation between the proportion of Haitians and poverty level among single mothers in the United States with a correlation coefficient (R) of 0.288 and weighted average of 29.8%. Similarly, the statistical analysis conducted on geographies consisting of 161,889,555 people shows a substantial positive correlation between the proportion of Immigrants from Sweden and poverty level among single mothers in the United States with a correlation coefficient (R) of 0.579 and weighted average of 27.5%, a difference of 8.5%.
Single Mother Poverty Correlation Summary
| Measurement | Haitian | Immigrants from Sweden |
| Minimum | 13.8% | 19.8% |
| Maximum | 52.2% | 62.7% |
| Range | 38.4% | 42.9% |
| Mean | 29.8% | 33.6% |
| Median | 28.8% | 27.7% |
| Interquartile 25% (IQ1) | 25.1% | 24.2% |
| Interquartile 75% (IQ3) | 32.7% | 47.2% |
| Interquartile Range (IQR) | 7.6% | 23.0% |
| Standard Deviation (Sample) | 7.4% | 14.2% |
| Standard Deviation (Population) | 7.4% | 13.7% |
Similar Demographics by Single Mother Poverty
Demographics Similar to Haitians by Single Mother Poverty
In terms of single mother poverty, the demographic groups most similar to Haitians are Guyanese (29.8%, a difference of 0.050%), Irish (29.8%, a difference of 0.060%), Nicaraguan (29.8%, a difference of 0.090%), Immigrants from Guyana (29.8%, a difference of 0.14%), and Immigrants from Thailand (29.9%, a difference of 0.14%).
| Demographics | Rating | Rank | Single Mother Poverty |
| Swiss | 17.2 /100 | #203 | Poor 29.7% |
| Immigrants | Immigrants | 16.6 /100 | #204 | Poor 29.7% |
| Czechoslovakians | 16.1 /100 | #205 | Poor 29.7% |
| Immigrants | Haiti | 15.8 /100 | #206 | Poor 29.7% |
| Immigrants | Panama | 15.5 /100 | #207 | Poor 29.8% |
| Immigrants | Guyana | 14.7 /100 | #208 | Poor 29.8% |
| Irish | 13.9 /100 | #209 | Poor 29.8% |
| Haitians | 13.3 /100 | #210 | Poor 29.8% |
| Guyanese | 12.8 /100 | #211 | Poor 29.8% |
| Nicaraguans | 12.4 /100 | #212 | Poor 29.8% |
| Immigrants | Thailand | 12.0 /100 | #213 | Poor 29.9% |
| Liberians | 11.7 /100 | #214 | Poor 29.9% |
| Jamaicans | 11.7 /100 | #215 | Poor 29.9% |
| Immigrants | Western Africa | 11.5 /100 | #216 | Poor 29.9% |
| Immigrants | Ghana | 11.3 /100 | #217 | Poor 29.9% |
Demographics Similar to Immigrants from Sweden by Single Mother Poverty
In terms of single mother poverty, the demographic groups most similar to Immigrants from Sweden are Peruvian (27.5%, a difference of 0.040%), Immigrants from Peru (27.5%, a difference of 0.060%), Immigrants from North Macedonia (27.5%, a difference of 0.080%), Immigrants from Italy (27.5%, a difference of 0.11%), and Taiwanese (27.5%, a difference of 0.11%).
| Demographics | Rating | Rank | Single Mother Poverty |
| Immigrants | Czechoslovakia | 99.5 /100 | #68 | Exceptional 27.4% |
| Lithuanians | 99.4 /100 | #69 | Exceptional 27.4% |
| Immigrants | Belarus | 99.4 /100 | #70 | Exceptional 27.4% |
| Macedonians | 99.4 /100 | #71 | Exceptional 27.4% |
| Immigrants | Russia | 99.4 /100 | #72 | Exceptional 27.4% |
| Sierra Leoneans | 99.3 /100 | #73 | Exceptional 27.4% |
| Immigrants | Europe | 99.3 /100 | #74 | Exceptional 27.4% |
| Immigrants | Sweden | 99.2 /100 | #75 | Exceptional 27.5% |
| Peruvians | 99.2 /100 | #76 | Exceptional 27.5% |
| Immigrants | Peru | 99.2 /100 | #77 | Exceptional 27.5% |
| Immigrants | North Macedonia | 99.2 /100 | #78 | Exceptional 27.5% |
| Immigrants | Italy | 99.1 /100 | #79 | Exceptional 27.5% |
| Taiwanese | 99.1 /100 | #80 | Exceptional 27.5% |
| Immigrants | Scotland | 98.9 /100 | #81 | Exceptional 27.6% |
| Immigrants | Cameroon | 98.8 /100 | #82 | Exceptional 27.6% |