Haitian vs Immigrants from Bulgaria Median Female Earnings
COMPARE
Haitian
Immigrants from Bulgaria
Median Female Earnings
Median Female Earnings Comparison
Haitians
Immigrants from Bulgaria
$36,374
MEDIAN FEMALE EARNINGS
0.1/ 100
METRIC RATING
282nd/ 347
METRIC RANK
$43,085
MEDIAN FEMALE EARNINGS
99.9/ 100
METRIC RATING
61st/ 347
METRIC RANK
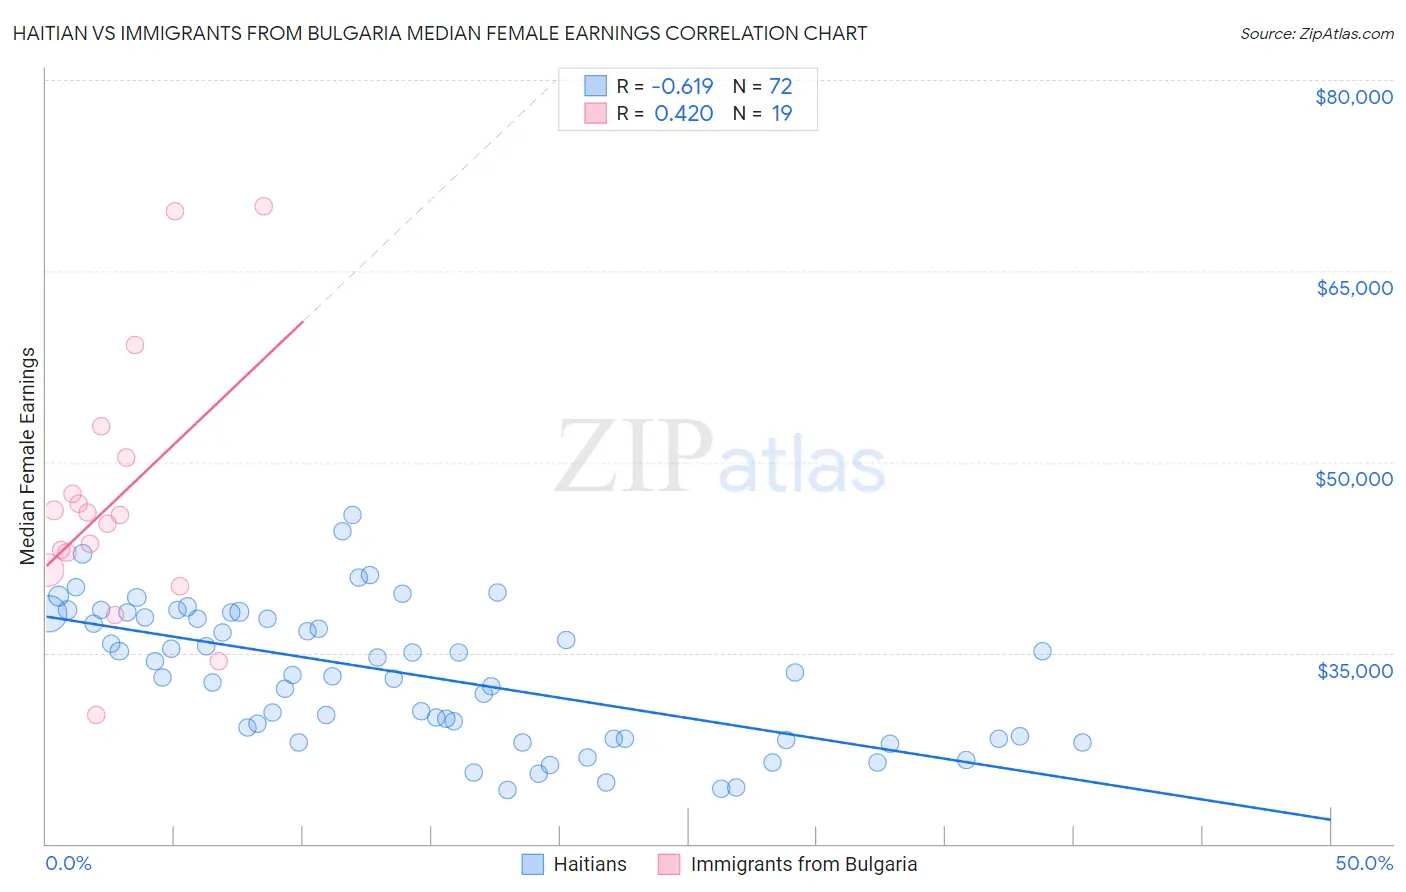
Haitian vs Immigrants from Bulgaria Median Female Earnings Correlation Chart
The statistical analysis conducted on geographies consisting of 287,899,387 people shows a significant negative correlation between the proportion of Haitians and median female earnings in the United States with a correlation coefficient (R) of -0.619 and weighted average of $36,374. Similarly, the statistical analysis conducted on geographies consisting of 172,533,051 people shows a moderate positive correlation between the proportion of Immigrants from Bulgaria and median female earnings in the United States with a correlation coefficient (R) of 0.420 and weighted average of $43,085, a difference of 18.4%.
Median Female Earnings Correlation Summary
| Measurement | Haitian | Immigrants from Bulgaria |
| Minimum | $24,245 | $30,131 |
| Maximum | $45,799 | $70,060 |
| Range | $21,554 | $39,929 |
| Mean | $33,333 | $47,007 |
| Median | $33,334 | $45,854 |
| Interquartile 25% (IQ1) | $28,287 | $41,489 |
| Interquartile 75% (IQ3) | $37,934 | $50,302 |
| Interquartile Range (IQR) | $9,647 | $8,813 |
| Standard Deviation (Sample) | $5,376 | $10,260 |
| Standard Deviation (Population) | $5,339 | $9,987 |
Similar Demographics by Median Female Earnings
Demographics Similar to Haitians by Median Female Earnings
In terms of median female earnings, the demographic groups most similar to Haitians are Spanish American ($36,391, a difference of 0.050%), Iroquois ($36,408, a difference of 0.090%), Immigrants from Caribbean ($36,414, a difference of 0.11%), U.S. Virgin Islander ($36,424, a difference of 0.14%), and Marshallese ($36,459, a difference of 0.24%).
| Demographics | Rating | Rank | Median Female Earnings |
| Africans | 0.1 /100 | #275 | Tragic $36,530 |
| Central Americans | 0.1 /100 | #276 | Tragic $36,492 |
| Marshallese | 0.1 /100 | #277 | Tragic $36,459 |
| U.S. Virgin Islanders | 0.1 /100 | #278 | Tragic $36,424 |
| Immigrants | Caribbean | 0.1 /100 | #279 | Tragic $36,414 |
| Iroquois | 0.1 /100 | #280 | Tragic $36,408 |
| Spanish Americans | 0.1 /100 | #281 | Tragic $36,391 |
| Haitians | 0.1 /100 | #282 | Tragic $36,374 |
| Immigrants | Haiti | 0.1 /100 | #283 | Tragic $36,203 |
| Indonesians | 0.1 /100 | #284 | Tragic $36,140 |
| Paiute | 0.1 /100 | #285 | Tragic $36,056 |
| Osage | 0.0 /100 | #286 | Tragic $36,034 |
| Immigrants | Nicaragua | 0.0 /100 | #287 | Tragic $36,023 |
| Immigrants | Zaire | 0.0 /100 | #288 | Tragic $36,017 |
| Bangladeshis | 0.0 /100 | #289 | Tragic $35,960 |
Demographics Similar to Immigrants from Bulgaria by Median Female Earnings
In terms of median female earnings, the demographic groups most similar to Immigrants from Bulgaria are Afghan ($43,077, a difference of 0.020%), Immigrants from Latvia ($43,099, a difference of 0.030%), Immigrants from Ukraine ($43,069, a difference of 0.040%), Estonian ($43,106, a difference of 0.050%), and Immigrants from Pakistan ($43,052, a difference of 0.080%).
| Demographics | Rating | Rank | Median Female Earnings |
| Australians | 99.9 /100 | #54 | Exceptional $43,308 |
| Egyptians | 99.9 /100 | #55 | Exceptional $43,305 |
| Immigrants | Croatia | 99.9 /100 | #56 | Exceptional $43,258 |
| Ethiopians | 99.9 /100 | #57 | Exceptional $43,243 |
| Paraguayans | 99.9 /100 | #58 | Exceptional $43,173 |
| Estonians | 99.9 /100 | #59 | Exceptional $43,106 |
| Immigrants | Latvia | 99.9 /100 | #60 | Exceptional $43,099 |
| Immigrants | Bulgaria | 99.9 /100 | #61 | Exceptional $43,085 |
| Afghans | 99.9 /100 | #62 | Exceptional $43,077 |
| Immigrants | Ukraine | 99.9 /100 | #63 | Exceptional $43,069 |
| Immigrants | Pakistan | 99.9 /100 | #64 | Exceptional $43,052 |
| Sierra Leoneans | 99.9 /100 | #65 | Exceptional $42,868 |
| Immigrants | Norway | 99.9 /100 | #66 | Exceptional $42,837 |
| Immigrants | Egypt | 99.9 /100 | #67 | Exceptional $42,837 |
| Immigrants | Austria | 99.8 /100 | #68 | Exceptional $42,824 |