Haitian vs Immigrants from Burma/Myanmar Median Female Earnings
COMPARE
Haitian
Immigrants from Burma/Myanmar
Median Female Earnings
Median Female Earnings Comparison
Haitians
Immigrants from Burma/Myanmar
$36,374
MEDIAN FEMALE EARNINGS
0.1/ 100
METRIC RATING
282nd/ 347
METRIC RANK
$38,028
MEDIAN FEMALE EARNINGS
3.0/ 100
METRIC RATING
242nd/ 347
METRIC RANK
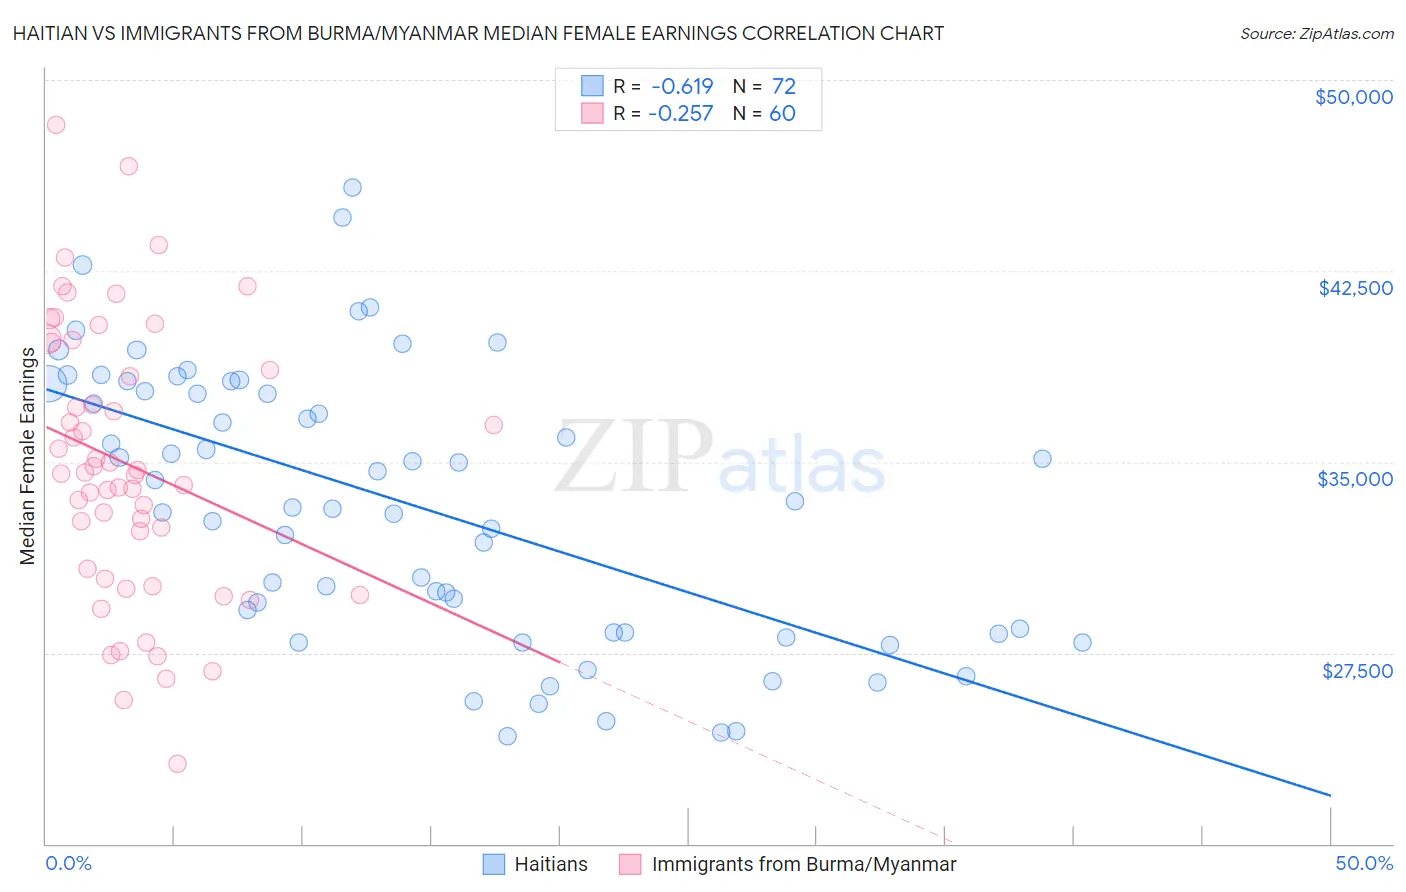
Haitian vs Immigrants from Burma/Myanmar Median Female Earnings Correlation Chart
The statistical analysis conducted on geographies consisting of 287,899,387 people shows a significant negative correlation between the proportion of Haitians and median female earnings in the United States with a correlation coefficient (R) of -0.619 and weighted average of $36,374. Similarly, the statistical analysis conducted on geographies consisting of 172,347,432 people shows a weak negative correlation between the proportion of Immigrants from Burma/Myanmar and median female earnings in the United States with a correlation coefficient (R) of -0.257 and weighted average of $38,028, a difference of 4.5%.
Median Female Earnings Correlation Summary
| Measurement | Haitian | Immigrants from Burma/Myanmar |
| Minimum | $24,245 | $23,125 |
| Maximum | $45,799 | $48,239 |
| Range | $21,554 | $25,114 |
| Mean | $33,333 | $34,892 |
| Median | $33,334 | $34,545 |
| Interquartile 25% (IQ1) | $28,287 | $30,606 |
| Interquartile 75% (IQ3) | $37,934 | $39,132 |
| Interquartile Range (IQR) | $9,647 | $8,525 |
| Standard Deviation (Sample) | $5,376 | $5,366 |
| Standard Deviation (Population) | $5,339 | $5,321 |
Similar Demographics by Median Female Earnings
Demographics Similar to Haitians by Median Female Earnings
In terms of median female earnings, the demographic groups most similar to Haitians are Spanish American ($36,391, a difference of 0.050%), Iroquois ($36,408, a difference of 0.090%), Immigrants from Caribbean ($36,414, a difference of 0.11%), U.S. Virgin Islander ($36,424, a difference of 0.14%), and Marshallese ($36,459, a difference of 0.24%).
| Demographics | Rating | Rank | Median Female Earnings |
| Africans | 0.1 /100 | #275 | Tragic $36,530 |
| Central Americans | 0.1 /100 | #276 | Tragic $36,492 |
| Marshallese | 0.1 /100 | #277 | Tragic $36,459 |
| U.S. Virgin Islanders | 0.1 /100 | #278 | Tragic $36,424 |
| Immigrants | Caribbean | 0.1 /100 | #279 | Tragic $36,414 |
| Iroquois | 0.1 /100 | #280 | Tragic $36,408 |
| Spanish Americans | 0.1 /100 | #281 | Tragic $36,391 |
| Haitians | 0.1 /100 | #282 | Tragic $36,374 |
| Immigrants | Haiti | 0.1 /100 | #283 | Tragic $36,203 |
| Indonesians | 0.1 /100 | #284 | Tragic $36,140 |
| Paiute | 0.1 /100 | #285 | Tragic $36,056 |
| Osage | 0.0 /100 | #286 | Tragic $36,034 |
| Immigrants | Nicaragua | 0.0 /100 | #287 | Tragic $36,023 |
| Immigrants | Zaire | 0.0 /100 | #288 | Tragic $36,017 |
| Bangladeshis | 0.0 /100 | #289 | Tragic $35,960 |
Demographics Similar to Immigrants from Burma/Myanmar by Median Female Earnings
In terms of median female earnings, the demographic groups most similar to Immigrants from Burma/Myanmar are German ($37,986, a difference of 0.11%), Immigrants from Liberia ($37,970, a difference of 0.15%), Immigrants from Middle Africa ($37,965, a difference of 0.17%), Delaware ($37,964, a difference of 0.17%), and Spanish ($38,098, a difference of 0.18%).
| Demographics | Rating | Rank | Median Female Earnings |
| Sudanese | 4.4 /100 | #235 | Tragic $38,215 |
| Liberians | 4.4 /100 | #236 | Tragic $38,215 |
| Immigrants | Cabo Verde | 4.3 /100 | #237 | Tragic $38,208 |
| Alaska Natives | 4.3 /100 | #238 | Tragic $38,202 |
| English | 4.2 /100 | #239 | Tragic $38,196 |
| Finns | 4.0 /100 | #240 | Tragic $38,173 |
| Spanish | 3.5 /100 | #241 | Tragic $38,098 |
| Immigrants | Burma/Myanmar | 3.0 /100 | #242 | Tragic $38,028 |
| Germans | 2.8 /100 | #243 | Tragic $37,986 |
| Immigrants | Liberia | 2.7 /100 | #244 | Tragic $37,970 |
| Immigrants | Middle Africa | 2.7 /100 | #245 | Tragic $37,965 |
| Delaware | 2.6 /100 | #246 | Tragic $37,964 |
| Immigrants | Somalia | 2.4 /100 | #247 | Tragic $37,914 |
| Alaskan Athabascans | 2.3 /100 | #248 | Tragic $37,905 |
| Swiss | 2.3 /100 | #249 | Tragic $37,904 |