Haitian vs Immigrants from Caribbean Median Female Earnings
COMPARE
Haitian
Immigrants from Caribbean
Median Female Earnings
Median Female Earnings Comparison
Haitians
Immigrants from Caribbean
$36,374
MEDIAN FEMALE EARNINGS
0.1/ 100
METRIC RATING
282nd/ 347
METRIC RANK
$36,414
MEDIAN FEMALE EARNINGS
0.1/ 100
METRIC RATING
279th/ 347
METRIC RANK
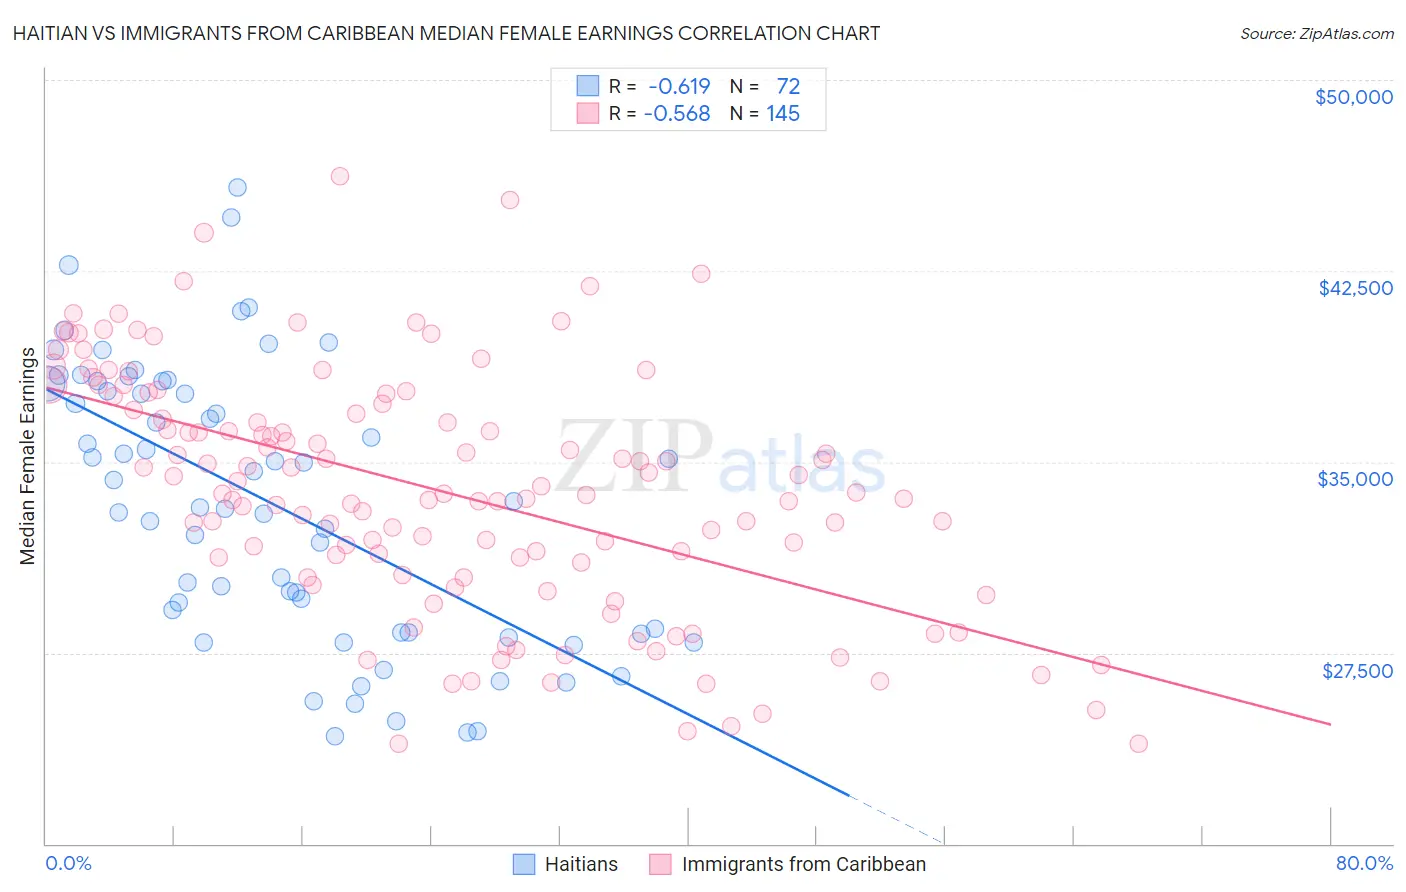
Haitian vs Immigrants from Caribbean Median Female Earnings Correlation Chart
The statistical analysis conducted on geographies consisting of 287,899,387 people shows a significant negative correlation between the proportion of Haitians and median female earnings in the United States with a correlation coefficient (R) of -0.619 and weighted average of $36,374. Similarly, the statistical analysis conducted on geographies consisting of 449,719,186 people shows a substantial negative correlation between the proportion of Immigrants from Caribbean and median female earnings in the United States with a correlation coefficient (R) of -0.568 and weighted average of $36,414, a difference of 0.11%.
Median Female Earnings Correlation Summary
| Measurement | Haitian | Immigrants from Caribbean |
| Minimum | $24,245 | $23,937 |
| Maximum | $45,799 | $46,205 |
| Range | $21,554 | $22,268 |
| Mean | $33,333 | $33,887 |
| Median | $33,334 | $33,768 |
| Interquartile 25% (IQ1) | $28,287 | $30,791 |
| Interquartile 75% (IQ3) | $37,934 | $37,444 |
| Interquartile Range (IQR) | $9,647 | $6,654 |
| Standard Deviation (Sample) | $5,376 | $4,730 |
| Standard Deviation (Population) | $5,339 | $4,714 |
Demographics Similar to Haitians and Immigrants from Caribbean by Median Female Earnings
In terms of median female earnings, the demographic groups most similar to Haitians are Spanish American ($36,391, a difference of 0.050%), Iroquois ($36,408, a difference of 0.090%), U.S. Virgin Islander ($36,424, a difference of 0.14%), Marshallese ($36,459, a difference of 0.24%), and Central American ($36,492, a difference of 0.33%). Similarly, the demographic groups most similar to Immigrants from Caribbean are Iroquois ($36,408, a difference of 0.020%), U.S. Virgin Islander ($36,424, a difference of 0.030%), Spanish American ($36,391, a difference of 0.060%), Marshallese ($36,459, a difference of 0.12%), and Central American ($36,492, a difference of 0.22%).
| Demographics | Rating | Rank | Median Female Earnings |
| French American Indians | 0.3 /100 | #270 | Tragic $36,920 |
| Nicaraguans | 0.3 /100 | #271 | Tragic $36,904 |
| Immigrants | Dominican Republic | 0.3 /100 | #272 | Tragic $36,857 |
| Immigrants | Laos | 0.3 /100 | #273 | Tragic $36,841 |
| Immigrants | El Salvador | 0.2 /100 | #274 | Tragic $36,673 |
| Africans | 0.1 /100 | #275 | Tragic $36,530 |
| Central Americans | 0.1 /100 | #276 | Tragic $36,492 |
| Marshallese | 0.1 /100 | #277 | Tragic $36,459 |
| U.S. Virgin Islanders | 0.1 /100 | #278 | Tragic $36,424 |
| Immigrants | Caribbean | 0.1 /100 | #279 | Tragic $36,414 |
| Iroquois | 0.1 /100 | #280 | Tragic $36,408 |
| Spanish Americans | 0.1 /100 | #281 | Tragic $36,391 |
| Haitians | 0.1 /100 | #282 | Tragic $36,374 |
| Immigrants | Haiti | 0.1 /100 | #283 | Tragic $36,203 |
| Indonesians | 0.1 /100 | #284 | Tragic $36,140 |
| Paiute | 0.1 /100 | #285 | Tragic $36,056 |
| Osage | 0.0 /100 | #286 | Tragic $36,034 |
| Immigrants | Nicaragua | 0.0 /100 | #287 | Tragic $36,023 |
| Immigrants | Zaire | 0.0 /100 | #288 | Tragic $36,017 |
| Bangladeshis | 0.0 /100 | #289 | Tragic $35,960 |
| Central American Indians | 0.0 /100 | #290 | Tragic $35,930 |