Turkish vs Immigrants from Sweden Median Female Earnings
COMPARE
Turkish
Immigrants from Sweden
Median Female Earnings
Median Female Earnings Comparison
Turks
Immigrants from Sweden
$44,695
MEDIAN FEMALE EARNINGS
100.0/ 100
METRIC RATING
27th/ 347
METRIC RANK
$44,774
MEDIAN FEMALE EARNINGS
100.0/ 100
METRIC RATING
25th/ 347
METRIC RANK
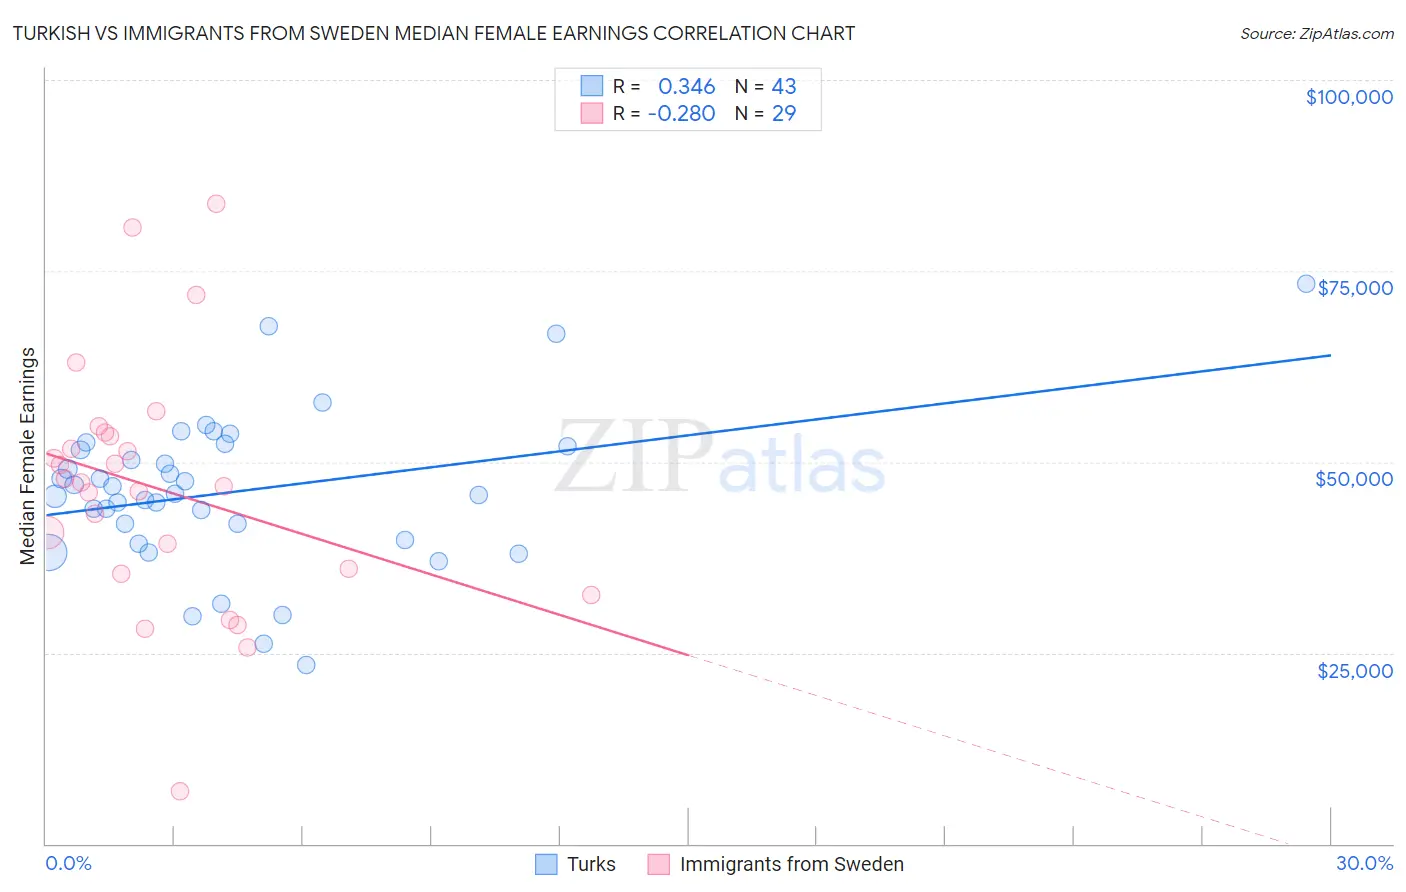
Turkish vs Immigrants from Sweden Median Female Earnings Correlation Chart
The statistical analysis conducted on geographies consisting of 271,816,857 people shows a mild positive correlation between the proportion of Turks and median female earnings in the United States with a correlation coefficient (R) of 0.346 and weighted average of $44,695. Similarly, the statistical analysis conducted on geographies consisting of 164,714,291 people shows a weak negative correlation between the proportion of Immigrants from Sweden and median female earnings in the United States with a correlation coefficient (R) of -0.280 and weighted average of $44,774, a difference of 0.18%.
Median Female Earnings Correlation Summary
| Measurement | Turkish | Immigrants from Sweden |
| Minimum | $23,409 | $6,800 |
| Maximum | $73,333 | $83,727 |
| Range | $49,924 | $76,927 |
| Mean | $46,115 | $46,568 |
| Median | $45,875 | $47,333 |
| Interquartile 25% (IQ1) | $39,746 | $35,642 |
| Interquartile 75% (IQ3) | $52,083 | $53,626 |
| Interquartile Range (IQR) | $12,337 | $17,985 |
| Standard Deviation (Sample) | $10,119 | $16,157 |
| Standard Deviation (Population) | $10,000 | $15,876 |
Demographics Similar to Turks and Immigrants from Sweden by Median Female Earnings
In terms of median female earnings, the demographic groups most similar to Turks are Immigrants from Russia ($44,680, a difference of 0.030%), Immigrants from Belarus ($44,757, a difference of 0.14%), Immigrants from Belgium ($44,587, a difference of 0.24%), Asian ($44,586, a difference of 0.24%), and Immigrants from Korea ($44,847, a difference of 0.34%). Similarly, the demographic groups most similar to Immigrants from Sweden are Immigrants from Belarus ($44,757, a difference of 0.040%), Immigrants from Korea ($44,847, a difference of 0.16%), Immigrants from Russia ($44,680, a difference of 0.21%), Burmese ($44,911, a difference of 0.31%), and Immigrants from Belgium ($44,587, a difference of 0.42%).
| Demographics | Rating | Rank | Median Female Earnings |
| Indians (Asian) | 100.0 /100 | #16 | Exceptional $46,481 |
| Immigrants | South Central Asia | 100.0 /100 | #17 | Exceptional $46,324 |
| Cypriots | 100.0 /100 | #18 | Exceptional $45,570 |
| Eastern Europeans | 100.0 /100 | #19 | Exceptional $45,385 |
| Immigrants | Japan | 100.0 /100 | #20 | Exceptional $45,323 |
| Cambodians | 100.0 /100 | #21 | Exceptional $45,014 |
| Immigrants | Greece | 100.0 /100 | #22 | Exceptional $44,976 |
| Burmese | 100.0 /100 | #23 | Exceptional $44,911 |
| Immigrants | Korea | 100.0 /100 | #24 | Exceptional $44,847 |
| Immigrants | Sweden | 100.0 /100 | #25 | Exceptional $44,774 |
| Immigrants | Belarus | 100.0 /100 | #26 | Exceptional $44,757 |
| Turks | 100.0 /100 | #27 | Exceptional $44,695 |
| Immigrants | Russia | 100.0 /100 | #28 | Exceptional $44,680 |
| Immigrants | Belgium | 100.0 /100 | #29 | Exceptional $44,587 |
| Asians | 100.0 /100 | #30 | Exceptional $44,586 |
| Immigrants | France | 100.0 /100 | #31 | Exceptional $44,541 |
| Immigrants | Northern Europe | 100.0 /100 | #32 | Exceptional $44,366 |
| Immigrants | Asia | 100.0 /100 | #33 | Exceptional $44,198 |
| Russians | 100.0 /100 | #34 | Exceptional $44,169 |
| Immigrants | Sri Lanka | 100.0 /100 | #35 | Exceptional $44,161 |
| Immigrants | Turkey | 100.0 /100 | #36 | Exceptional $44,066 |