Guatemalan vs Mongolian Median Male Earnings
COMPARE
Guatemalan
Mongolian
Median Male Earnings
Median Male Earnings Comparison
Guatemalans
Mongolians
$46,736
MEDIAN MALE EARNINGS
0.0/ 100
METRIC RATING
305th/ 347
METRIC RANK
$60,350
MEDIAN MALE EARNINGS
99.7/ 100
METRIC RATING
71st/ 347
METRIC RANK
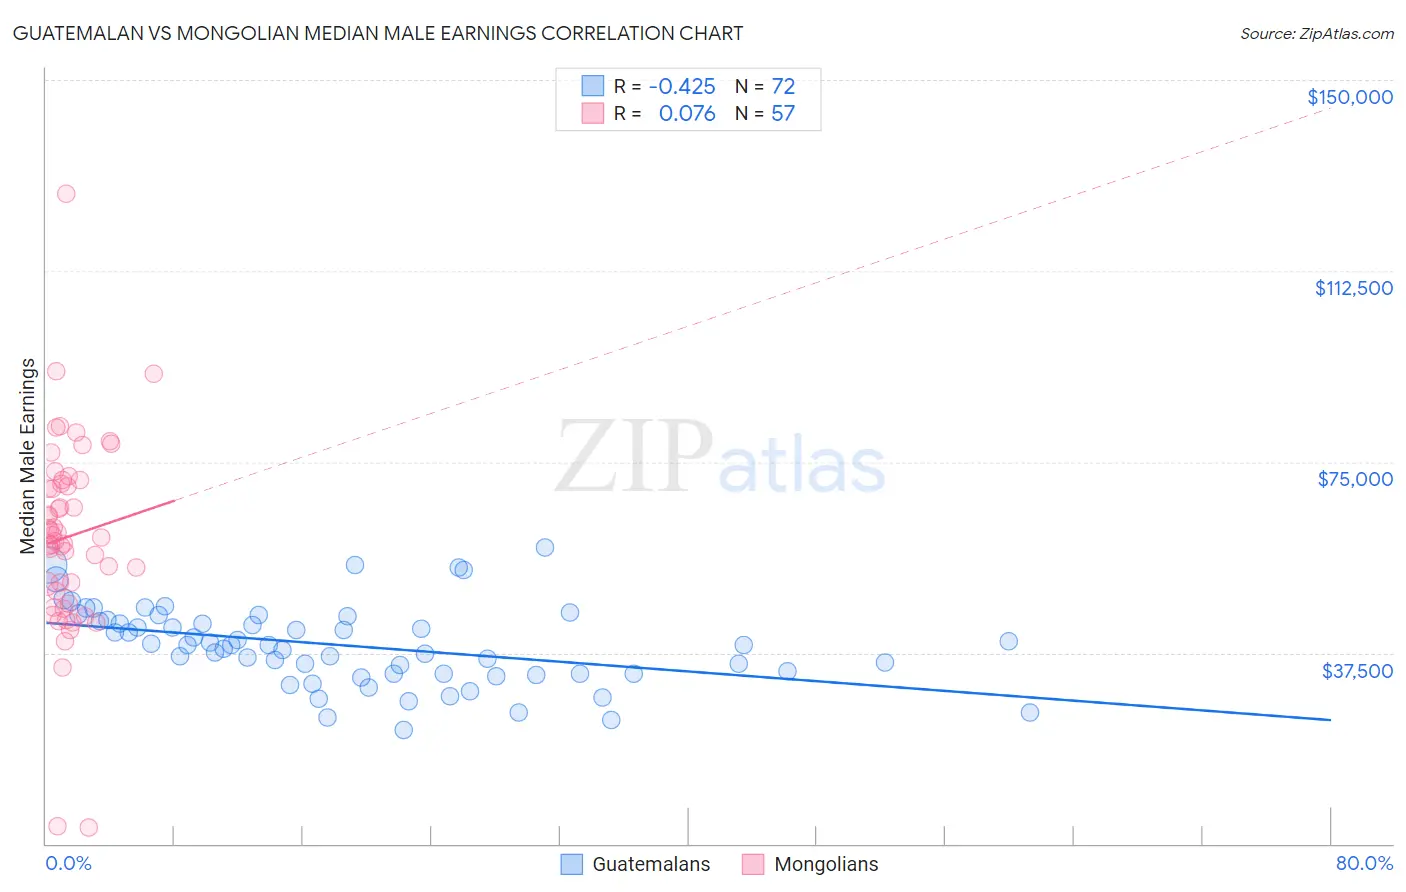
Guatemalan vs Mongolian Median Male Earnings Correlation Chart
The statistical analysis conducted on geographies consisting of 409,446,207 people shows a moderate negative correlation between the proportion of Guatemalans and median male earnings in the United States with a correlation coefficient (R) of -0.425 and weighted average of $46,736. Similarly, the statistical analysis conducted on geographies consisting of 140,336,104 people shows a slight positive correlation between the proportion of Mongolians and median male earnings in the United States with a correlation coefficient (R) of 0.076 and weighted average of $60,350, a difference of 29.1%.
Median Male Earnings Correlation Summary
| Measurement | Guatemalan | Mongolian |
| Minimum | $22,332 | $3,109 |
| Maximum | $58,162 | $127,545 |
| Range | $35,830 | $124,436 |
| Mean | $38,925 | $60,323 |
| Median | $39,033 | $60,102 |
| Interquartile 25% (IQ1) | $33,424 | $48,308 |
| Interquartile 75% (IQ3) | $43,885 | $71,104 |
| Interquartile Range (IQR) | $10,461 | $22,796 |
| Standard Deviation (Sample) | $7,785 | $19,294 |
| Standard Deviation (Population) | $7,731 | $19,124 |
Similar Demographics by Median Male Earnings
Demographics Similar to Guatemalans by Median Male Earnings
In terms of median male earnings, the demographic groups most similar to Guatemalans are Bangladeshi ($46,744, a difference of 0.020%), Yaqui ($46,777, a difference of 0.090%), Seminole ($46,783, a difference of 0.10%), Dutch West Indian ($46,656, a difference of 0.17%), and Immigrants from Dominican Republic ($46,655, a difference of 0.17%).
| Demographics | Rating | Rank | Median Male Earnings |
| Immigrants | Micronesia | 0.1 /100 | #298 | Tragic $47,177 |
| Immigrants | Zaire | 0.1 /100 | #299 | Tragic $47,070 |
| U.S. Virgin Islanders | 0.1 /100 | #300 | Tragic $47,066 |
| Immigrants | Latin America | 0.1 /100 | #301 | Tragic $46,941 |
| Seminole | 0.1 /100 | #302 | Tragic $46,783 |
| Yaqui | 0.1 /100 | #303 | Tragic $46,777 |
| Bangladeshis | 0.1 /100 | #304 | Tragic $46,744 |
| Guatemalans | 0.0 /100 | #305 | Tragic $46,736 |
| Dutch West Indians | 0.0 /100 | #306 | Tragic $46,656 |
| Immigrants | Dominican Republic | 0.0 /100 | #307 | Tragic $46,655 |
| Ottawa | 0.0 /100 | #308 | Tragic $46,611 |
| Creek | 0.0 /100 | #309 | Tragic $46,594 |
| Cubans | 0.0 /100 | #310 | Tragic $46,580 |
| Apache | 0.0 /100 | #311 | Tragic $46,429 |
| Hispanics or Latinos | 0.0 /100 | #312 | Tragic $46,419 |
Demographics Similar to Mongolians by Median Male Earnings
In terms of median male earnings, the demographic groups most similar to Mongolians are Immigrants from Bulgaria ($60,358, a difference of 0.010%), Immigrants from Western Europe ($60,334, a difference of 0.030%), Immigrants from Canada ($60,388, a difference of 0.060%), Immigrants from North America ($60,265, a difference of 0.14%), and Argentinean ($60,117, a difference of 0.39%).
| Demographics | Rating | Rank | Median Male Earnings |
| Immigrants | Eastern Europe | 99.8 /100 | #64 | Exceptional $60,958 |
| Immigrants | Indonesia | 99.8 /100 | #65 | Exceptional $60,935 |
| Immigrants | Croatia | 99.8 /100 | #66 | Exceptional $60,914 |
| Immigrants | Spain | 99.8 /100 | #67 | Exceptional $60,750 |
| Immigrants | Serbia | 99.7 /100 | #68 | Exceptional $60,600 |
| Immigrants | Canada | 99.7 /100 | #69 | Exceptional $60,388 |
| Immigrants | Bulgaria | 99.7 /100 | #70 | Exceptional $60,358 |
| Mongolians | 99.7 /100 | #71 | Exceptional $60,350 |
| Immigrants | Western Europe | 99.7 /100 | #72 | Exceptional $60,334 |
| Immigrants | North America | 99.7 /100 | #73 | Exceptional $60,265 |
| Argentineans | 99.6 /100 | #74 | Exceptional $60,117 |
| Immigrants | Bolivia | 99.6 /100 | #75 | Exceptional $60,088 |
| Romanians | 99.6 /100 | #76 | Exceptional $60,063 |
| Paraguayans | 99.5 /100 | #77 | Exceptional $59,975 |
| Immigrants | Egypt | 99.5 /100 | #78 | Exceptional $59,925 |