Guatemalan vs Chippewa Median Male Earnings
COMPARE
Guatemalan
Chippewa
Median Male Earnings
Median Male Earnings Comparison
Guatemalans
Chippewa
$46,736
MEDIAN MALE EARNINGS
0.0/ 100
METRIC RATING
305th/ 347
METRIC RANK
$46,368
MEDIAN MALE EARNINGS
0.0/ 100
METRIC RATING
314th/ 347
METRIC RANK
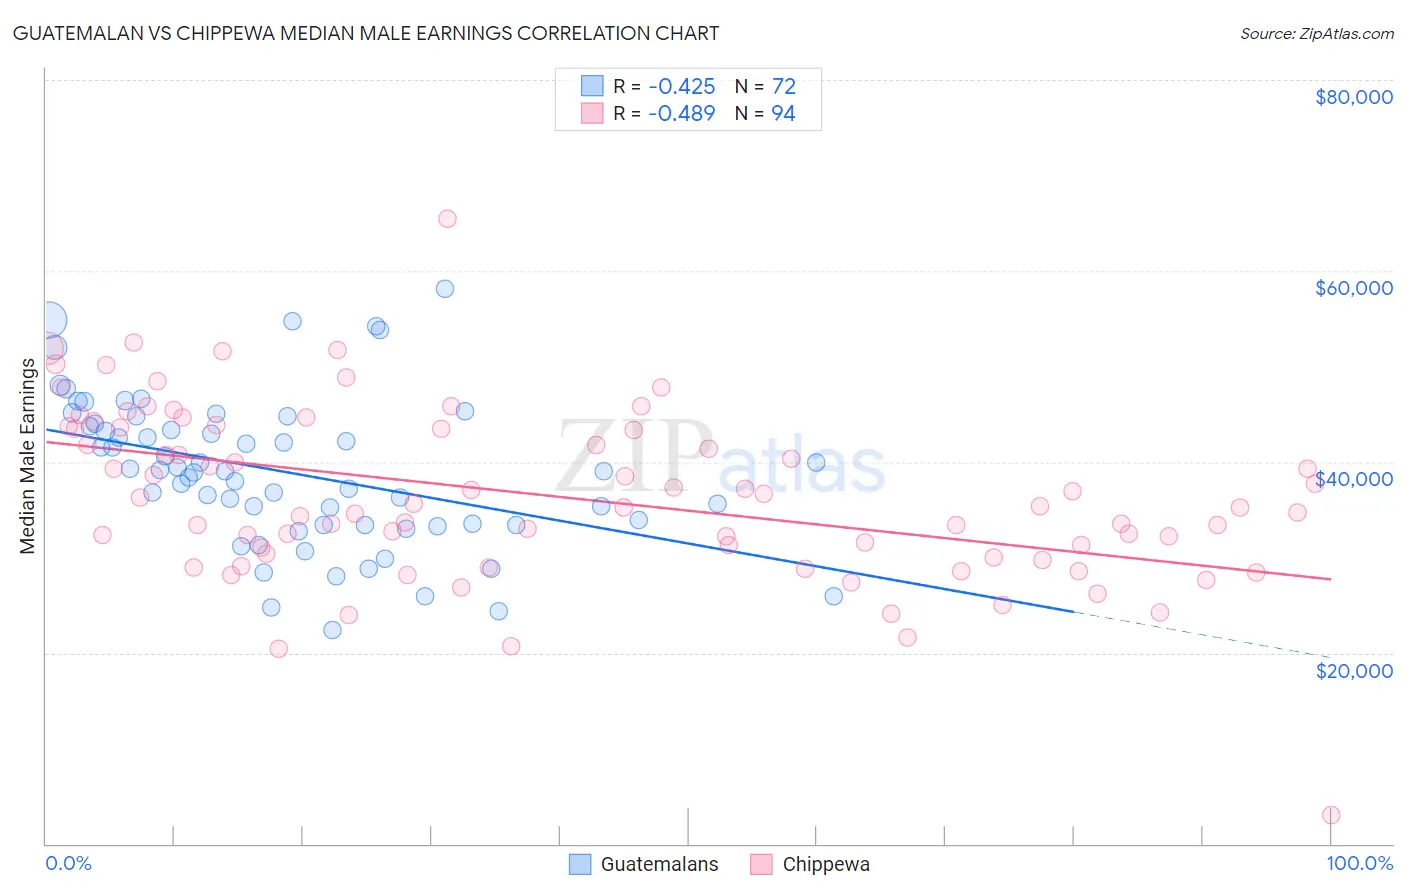
Guatemalan vs Chippewa Median Male Earnings Correlation Chart
The statistical analysis conducted on geographies consisting of 409,446,207 people shows a moderate negative correlation between the proportion of Guatemalans and median male earnings in the United States with a correlation coefficient (R) of -0.425 and weighted average of $46,736. Similarly, the statistical analysis conducted on geographies consisting of 215,007,267 people shows a moderate negative correlation between the proportion of Chippewa and median male earnings in the United States with a correlation coefficient (R) of -0.489 and weighted average of $46,368, a difference of 0.79%.
Median Male Earnings Correlation Summary
| Measurement | Guatemalan | Chippewa |
| Minimum | $22,332 | $3,000 |
| Maximum | $58,162 | $65,417 |
| Range | $35,830 | $62,417 |
| Mean | $38,925 | $36,432 |
| Median | $39,033 | $35,290 |
| Interquartile 25% (IQ1) | $33,424 | $30,344 |
| Interquartile 75% (IQ3) | $43,885 | $43,504 |
| Interquartile Range (IQR) | $10,461 | $13,160 |
| Standard Deviation (Sample) | $7,785 | $9,091 |
| Standard Deviation (Population) | $7,731 | $9,042 |
Demographics Similar to Guatemalans and Chippewa by Median Male Earnings
In terms of median male earnings, the demographic groups most similar to Guatemalans are Bangladeshi ($46,744, a difference of 0.020%), Yaqui ($46,777, a difference of 0.090%), Seminole ($46,783, a difference of 0.10%), Dutch West Indian ($46,656, a difference of 0.17%), and Immigrants from Dominican Republic ($46,655, a difference of 0.17%). Similarly, the demographic groups most similar to Chippewa are Honduran ($46,374, a difference of 0.010%), Hispanic or Latino ($46,419, a difference of 0.11%), Apache ($46,429, a difference of 0.13%), Immigrants from Guatemala ($46,244, a difference of 0.27%), and Immigrants from Caribbean ($46,193, a difference of 0.38%).
| Demographics | Rating | Rank | Median Male Earnings |
| Immigrants | Zaire | 0.1 /100 | #299 | Tragic $47,070 |
| U.S. Virgin Islanders | 0.1 /100 | #300 | Tragic $47,066 |
| Immigrants | Latin America | 0.1 /100 | #301 | Tragic $46,941 |
| Seminole | 0.1 /100 | #302 | Tragic $46,783 |
| Yaqui | 0.1 /100 | #303 | Tragic $46,777 |
| Bangladeshis | 0.1 /100 | #304 | Tragic $46,744 |
| Guatemalans | 0.0 /100 | #305 | Tragic $46,736 |
| Dutch West Indians | 0.0 /100 | #306 | Tragic $46,656 |
| Immigrants | Dominican Republic | 0.0 /100 | #307 | Tragic $46,655 |
| Ottawa | 0.0 /100 | #308 | Tragic $46,611 |
| Creek | 0.0 /100 | #309 | Tragic $46,594 |
| Cubans | 0.0 /100 | #310 | Tragic $46,580 |
| Apache | 0.0 /100 | #311 | Tragic $46,429 |
| Hispanics or Latinos | 0.0 /100 | #312 | Tragic $46,419 |
| Hondurans | 0.0 /100 | #313 | Tragic $46,374 |
| Chippewa | 0.0 /100 | #314 | Tragic $46,368 |
| Immigrants | Guatemala | 0.0 /100 | #315 | Tragic $46,244 |
| Immigrants | Caribbean | 0.0 /100 | #316 | Tragic $46,193 |
| Mexicans | 0.0 /100 | #317 | Tragic $46,147 |
| Cheyenne | 0.0 /100 | #318 | Tragic $46,062 |
| Haitians | 0.0 /100 | #319 | Tragic $45,903 |