Guatemalan vs Puget Sound Salish Median Male Earnings
COMPARE
Guatemalan
Puget Sound Salish
Median Male Earnings
Median Male Earnings Comparison
Guatemalans
Puget Sound Salish
$46,736
MEDIAN MALE EARNINGS
0.0/ 100
METRIC RATING
305th/ 347
METRIC RANK
$53,704
MEDIAN MALE EARNINGS
31.6/ 100
METRIC RATING
189th/ 347
METRIC RANK
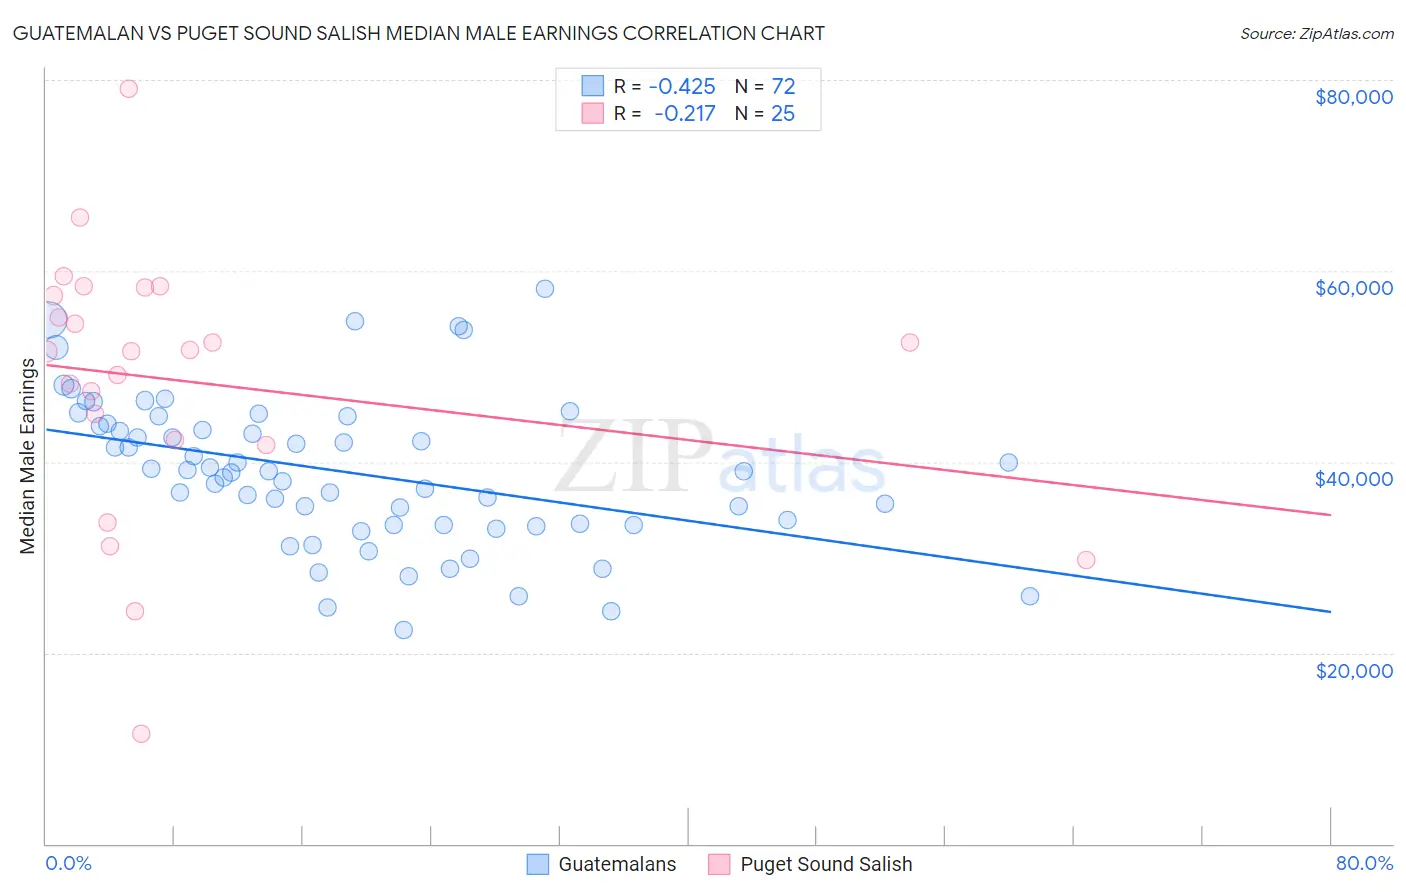
Guatemalan vs Puget Sound Salish Median Male Earnings Correlation Chart
The statistical analysis conducted on geographies consisting of 409,446,207 people shows a moderate negative correlation between the proportion of Guatemalans and median male earnings in the United States with a correlation coefficient (R) of -0.425 and weighted average of $46,736. Similarly, the statistical analysis conducted on geographies consisting of 46,150,456 people shows a weak negative correlation between the proportion of Puget Sound Salish and median male earnings in the United States with a correlation coefficient (R) of -0.217 and weighted average of $53,704, a difference of 14.9%.
Median Male Earnings Correlation Summary
| Measurement | Guatemalan | Puget Sound Salish |
| Minimum | $22,332 | $11,507 |
| Maximum | $58,162 | $79,042 |
| Range | $35,830 | $67,535 |
| Mean | $38,925 | $48,401 |
| Median | $39,033 | $51,583 |
| Interquartile 25% (IQ1) | $33,424 | $42,007 |
| Interquartile 75% (IQ3) | $43,885 | $57,855 |
| Interquartile Range (IQR) | $10,461 | $15,848 |
| Standard Deviation (Sample) | $7,785 | $14,112 |
| Standard Deviation (Population) | $7,731 | $13,827 |
Similar Demographics by Median Male Earnings
Demographics Similar to Guatemalans by Median Male Earnings
In terms of median male earnings, the demographic groups most similar to Guatemalans are Bangladeshi ($46,744, a difference of 0.020%), Yaqui ($46,777, a difference of 0.090%), Seminole ($46,783, a difference of 0.10%), Dutch West Indian ($46,656, a difference of 0.17%), and Immigrants from Dominican Republic ($46,655, a difference of 0.17%).
| Demographics | Rating | Rank | Median Male Earnings |
| Immigrants | Micronesia | 0.1 /100 | #298 | Tragic $47,177 |
| Immigrants | Zaire | 0.1 /100 | #299 | Tragic $47,070 |
| U.S. Virgin Islanders | 0.1 /100 | #300 | Tragic $47,066 |
| Immigrants | Latin America | 0.1 /100 | #301 | Tragic $46,941 |
| Seminole | 0.1 /100 | #302 | Tragic $46,783 |
| Yaqui | 0.1 /100 | #303 | Tragic $46,777 |
| Bangladeshis | 0.1 /100 | #304 | Tragic $46,744 |
| Guatemalans | 0.0 /100 | #305 | Tragic $46,736 |
| Dutch West Indians | 0.0 /100 | #306 | Tragic $46,656 |
| Immigrants | Dominican Republic | 0.0 /100 | #307 | Tragic $46,655 |
| Ottawa | 0.0 /100 | #308 | Tragic $46,611 |
| Creek | 0.0 /100 | #309 | Tragic $46,594 |
| Cubans | 0.0 /100 | #310 | Tragic $46,580 |
| Apache | 0.0 /100 | #311 | Tragic $46,429 |
| Hispanics or Latinos | 0.0 /100 | #312 | Tragic $46,419 |
Demographics Similar to Puget Sound Salish by Median Male Earnings
In terms of median male earnings, the demographic groups most similar to Puget Sound Salish are Immigrants from Eritrea ($53,715, a difference of 0.020%), Immigrants from Eastern Africa ($53,713, a difference of 0.020%), Uruguayan ($53,680, a difference of 0.040%), Guamanian/Chamorro ($53,661, a difference of 0.080%), and Scotch-Irish ($53,658, a difference of 0.090%).
| Demographics | Rating | Rank | Median Male Earnings |
| Yugoslavians | 37.4 /100 | #182 | Fair $53,967 |
| Immigrants | South America | 37.3 /100 | #183 | Fair $53,962 |
| Whites/Caucasians | 36.5 /100 | #184 | Fair $53,925 |
| Immigrants | Sierra Leone | 36.0 /100 | #185 | Fair $53,905 |
| Colombians | 34.4 /100 | #186 | Fair $53,832 |
| Immigrants | Eritrea | 31.8 /100 | #187 | Fair $53,715 |
| Immigrants | Eastern Africa | 31.8 /100 | #188 | Fair $53,713 |
| Puget Sound Salish | 31.6 /100 | #189 | Fair $53,704 |
| Uruguayans | 31.1 /100 | #190 | Fair $53,680 |
| Guamanians/Chamorros | 30.7 /100 | #191 | Fair $53,661 |
| Scotch-Irish | 30.6 /100 | #192 | Fair $53,658 |
| Kenyans | 30.4 /100 | #193 | Fair $53,647 |
| Spanish | 29.0 /100 | #194 | Fair $53,576 |
| Immigrants | Azores | 27.5 /100 | #195 | Fair $53,503 |
| Immigrants | Africa | 26.6 /100 | #196 | Fair $53,457 |