Comanche vs Mongolian Median Male Earnings
COMPARE
Comanche
Mongolian
Median Male Earnings
Median Male Earnings Comparison
Comanche
Mongolians
$48,202
MEDIAN MALE EARNINGS
0.2/ 100
METRIC RATING
280th/ 347
METRIC RANK
$60,350
MEDIAN MALE EARNINGS
99.7/ 100
METRIC RATING
71st/ 347
METRIC RANK
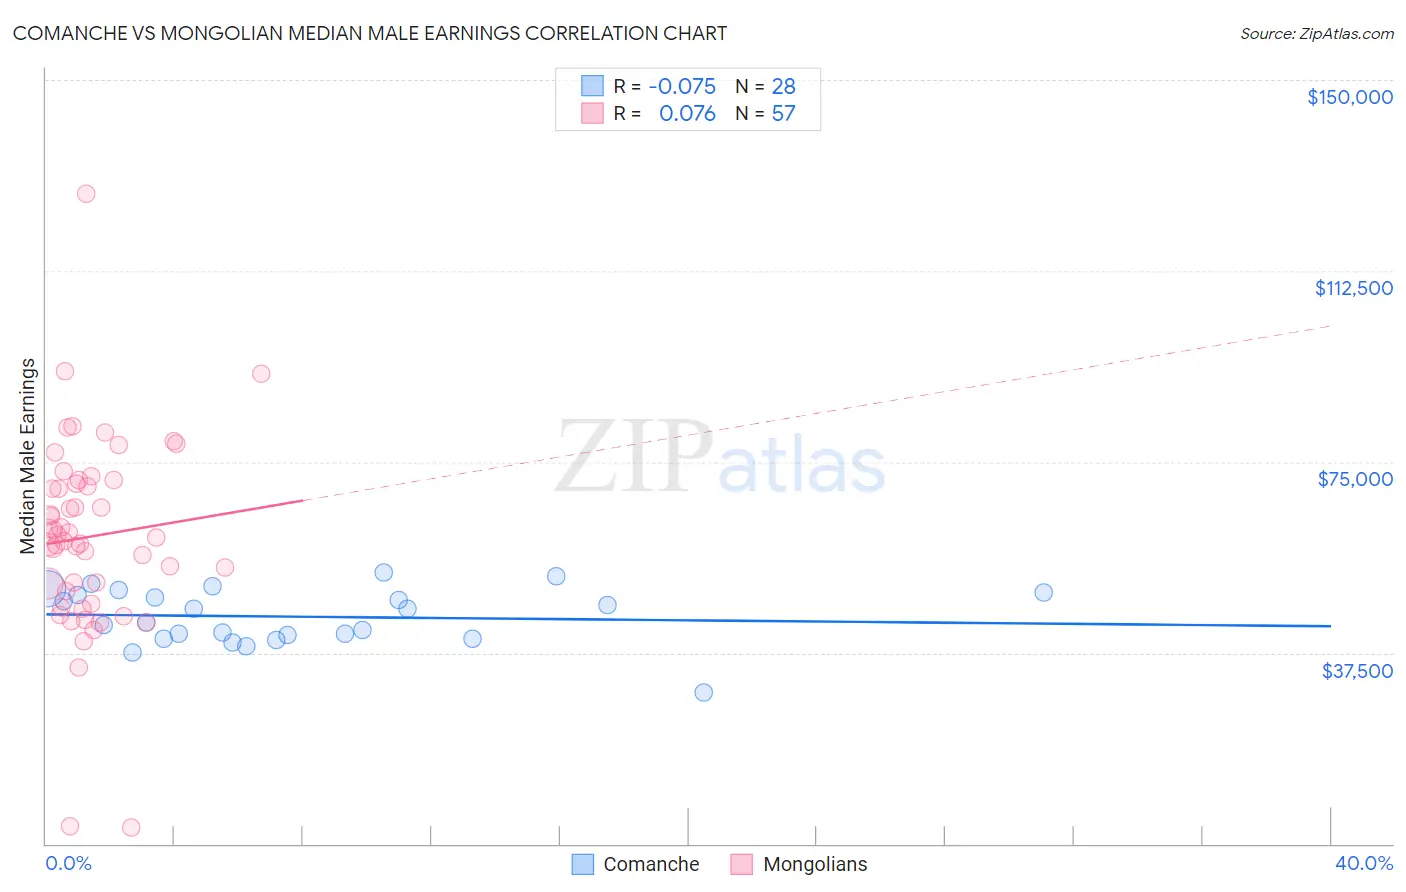
Comanche vs Mongolian Median Male Earnings Correlation Chart
The statistical analysis conducted on geographies consisting of 109,761,350 people shows a slight negative correlation between the proportion of Comanche and median male earnings in the United States with a correlation coefficient (R) of -0.075 and weighted average of $48,202. Similarly, the statistical analysis conducted on geographies consisting of 140,336,104 people shows a slight positive correlation between the proportion of Mongolians and median male earnings in the United States with a correlation coefficient (R) of 0.076 and weighted average of $60,350, a difference of 25.2%.
Median Male Earnings Correlation Summary
| Measurement | Comanche | Mongolian |
| Minimum | $29,698 | $3,109 |
| Maximum | $53,182 | $127,545 |
| Range | $23,484 | $124,436 |
| Mean | $44,594 | $60,323 |
| Median | $44,855 | $60,102 |
| Interquartile 25% (IQ1) | $40,605 | $48,308 |
| Interquartile 75% (IQ3) | $49,111 | $71,104 |
| Interquartile Range (IQR) | $8,506 | $22,796 |
| Standard Deviation (Sample) | $5,459 | $19,294 |
| Standard Deviation (Population) | $5,361 | $19,124 |
Similar Demographics by Median Male Earnings
Demographics Similar to Comanche by Median Male Earnings
In terms of median male earnings, the demographic groups most similar to Comanche are Hmong ($48,254, a difference of 0.11%), Marshallese ($48,137, a difference of 0.13%), Central American ($48,093, a difference of 0.23%), Immigrants from Liberia ($48,317, a difference of 0.24%), and Belizean ($48,358, a difference of 0.32%).
| Demographics | Rating | Rank | Median Male Earnings |
| Jamaicans | 0.3 /100 | #273 | Tragic $48,632 |
| Colville | 0.3 /100 | #274 | Tragic $48,516 |
| Immigrants | Somalia | 0.3 /100 | #275 | Tragic $48,439 |
| Blackfeet | 0.3 /100 | #276 | Tragic $48,402 |
| Belizeans | 0.2 /100 | #277 | Tragic $48,358 |
| Immigrants | Liberia | 0.2 /100 | #278 | Tragic $48,317 |
| Hmong | 0.2 /100 | #279 | Tragic $48,254 |
| Comanche | 0.2 /100 | #280 | Tragic $48,202 |
| Marshallese | 0.2 /100 | #281 | Tragic $48,137 |
| Central Americans | 0.2 /100 | #282 | Tragic $48,093 |
| Immigrants | Jamaica | 0.2 /100 | #283 | Tragic $48,040 |
| Africans | 0.2 /100 | #284 | Tragic $47,994 |
| Paiute | 0.2 /100 | #285 | Tragic $47,991 |
| Mexican American Indians | 0.2 /100 | #286 | Tragic $47,990 |
| Immigrants | El Salvador | 0.2 /100 | #287 | Tragic $47,973 |
Demographics Similar to Mongolians by Median Male Earnings
In terms of median male earnings, the demographic groups most similar to Mongolians are Immigrants from Bulgaria ($60,358, a difference of 0.010%), Immigrants from Western Europe ($60,334, a difference of 0.030%), Immigrants from Canada ($60,388, a difference of 0.060%), Immigrants from North America ($60,265, a difference of 0.14%), and Argentinean ($60,117, a difference of 0.39%).
| Demographics | Rating | Rank | Median Male Earnings |
| Immigrants | Eastern Europe | 99.8 /100 | #64 | Exceptional $60,958 |
| Immigrants | Indonesia | 99.8 /100 | #65 | Exceptional $60,935 |
| Immigrants | Croatia | 99.8 /100 | #66 | Exceptional $60,914 |
| Immigrants | Spain | 99.8 /100 | #67 | Exceptional $60,750 |
| Immigrants | Serbia | 99.7 /100 | #68 | Exceptional $60,600 |
| Immigrants | Canada | 99.7 /100 | #69 | Exceptional $60,388 |
| Immigrants | Bulgaria | 99.7 /100 | #70 | Exceptional $60,358 |
| Mongolians | 99.7 /100 | #71 | Exceptional $60,350 |
| Immigrants | Western Europe | 99.7 /100 | #72 | Exceptional $60,334 |
| Immigrants | North America | 99.7 /100 | #73 | Exceptional $60,265 |
| Argentineans | 99.6 /100 | #74 | Exceptional $60,117 |
| Immigrants | Bolivia | 99.6 /100 | #75 | Exceptional $60,088 |
| Romanians | 99.6 /100 | #76 | Exceptional $60,063 |
| Paraguayans | 99.5 /100 | #77 | Exceptional $59,975 |
| Immigrants | Egypt | 99.5 /100 | #78 | Exceptional $59,925 |