Guatemalan vs Mongolian Per Capita Income
COMPARE
Guatemalan
Mongolian
Per Capita Income
Per Capita Income Comparison
Guatemalans
Mongolians
$37,766
PER CAPITA INCOME
0.1/ 100
METRIC RATING
285th/ 347
METRIC RANK
$49,173
PER CAPITA INCOME
99.8/ 100
METRIC RATING
74th/ 347
METRIC RANK
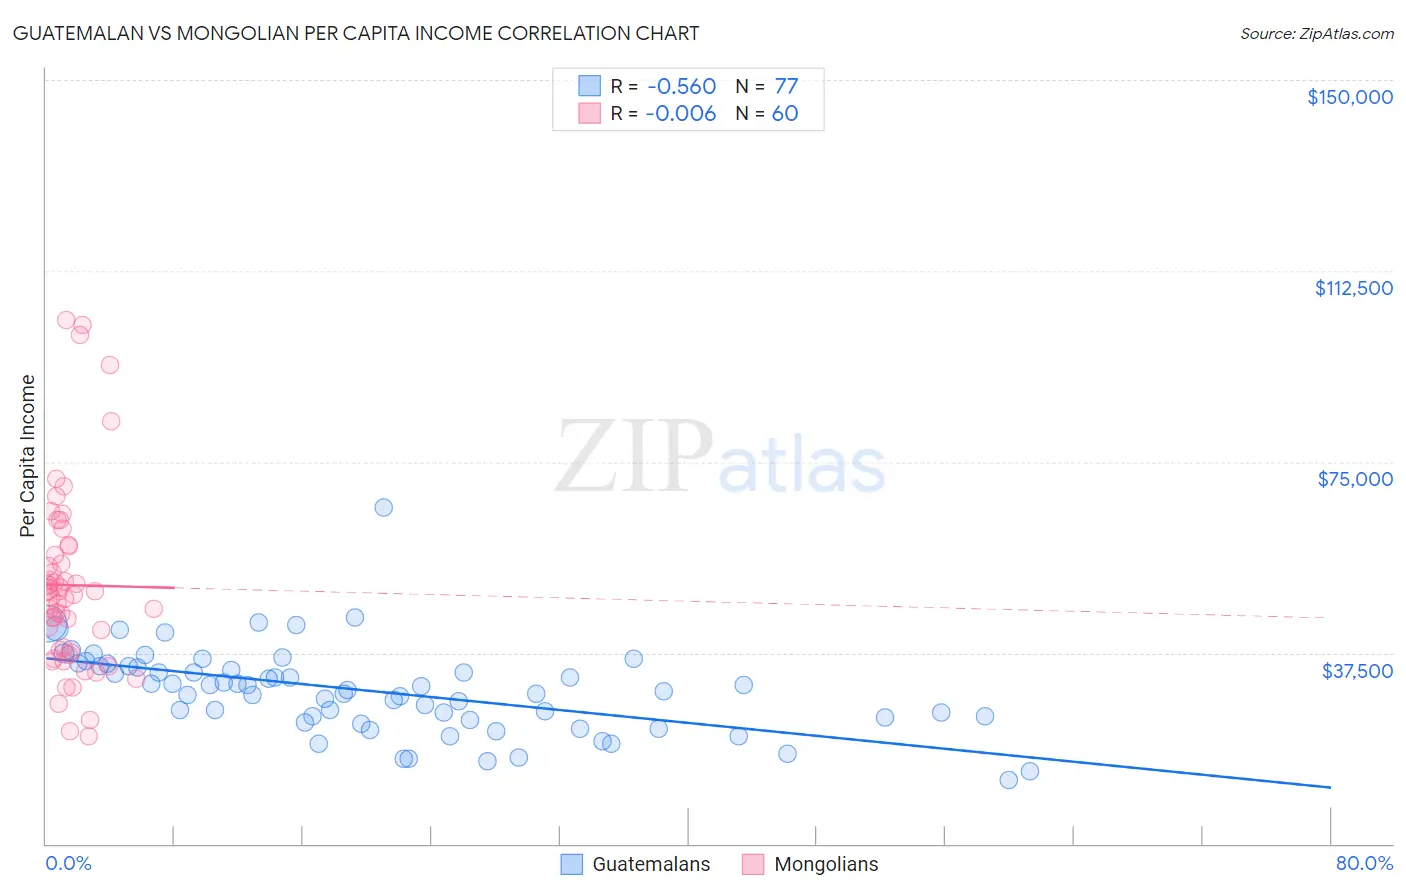
Guatemalan vs Mongolian Per Capita Income Correlation Chart
The statistical analysis conducted on geographies consisting of 409,586,498 people shows a substantial negative correlation between the proportion of Guatemalans and per capita income in the United States with a correlation coefficient (R) of -0.560 and weighted average of $37,766. Similarly, the statistical analysis conducted on geographies consisting of 140,356,705 people shows no correlation between the proportion of Mongolians and per capita income in the United States with a correlation coefficient (R) of -0.006 and weighted average of $49,173, a difference of 30.2%.
Per Capita Income Correlation Summary
| Measurement | Guatemalan | Mongolian |
| Minimum | $12,606 | $21,025 |
| Maximum | $66,145 | $102,845 |
| Range | $53,539 | $81,820 |
| Mean | $29,994 | $50,803 |
| Median | $30,165 | $49,216 |
| Interquartile 25% (IQ1) | $24,578 | $37,778 |
| Interquartile 75% (IQ3) | $34,822 | $57,579 |
| Interquartile Range (IQR) | $10,244 | $19,802 |
| Standard Deviation (Sample) | $8,508 | $18,159 |
| Standard Deviation (Population) | $8,452 | $18,007 |
Similar Demographics by Per Capita Income
Demographics Similar to Guatemalans by Per Capita Income
In terms of per capita income, the demographic groups most similar to Guatemalans are African ($37,785, a difference of 0.050%), Central American Indian ($37,699, a difference of 0.18%), Dominican ($37,697, a difference of 0.19%), Blackfeet ($37,695, a difference of 0.19%), and Pennsylvania German ($37,842, a difference of 0.20%).
| Demographics | Rating | Rank | Per Capita Income |
| Immigrants | Nicaragua | 0.2 /100 | #278 | Tragic $38,065 |
| Colville | 0.2 /100 | #279 | Tragic $38,047 |
| Potawatomi | 0.2 /100 | #280 | Tragic $38,046 |
| Immigrants | Dominica | 0.2 /100 | #281 | Tragic $37,952 |
| Immigrants | Laos | 0.1 /100 | #282 | Tragic $37,857 |
| Pennsylvania Germans | 0.1 /100 | #283 | Tragic $37,842 |
| Africans | 0.1 /100 | #284 | Tragic $37,785 |
| Guatemalans | 0.1 /100 | #285 | Tragic $37,766 |
| Central American Indians | 0.1 /100 | #286 | Tragic $37,699 |
| Dominicans | 0.1 /100 | #287 | Tragic $37,697 |
| Blackfeet | 0.1 /100 | #288 | Tragic $37,695 |
| U.S. Virgin Islanders | 0.1 /100 | #289 | Tragic $37,589 |
| Immigrants | Guatemala | 0.1 /100 | #290 | Tragic $37,550 |
| Cajuns | 0.1 /100 | #291 | Tragic $37,527 |
| Immigrants | Micronesia | 0.1 /100 | #292 | Tragic $37,464 |
Demographics Similar to Mongolians by Per Capita Income
In terms of per capita income, the demographic groups most similar to Mongolians are Immigrants from Hungary ($49,303, a difference of 0.26%), Immigrants from North America ($49,302, a difference of 0.26%), Greek ($49,309, a difference of 0.28%), Immigrants from Eastern Europe ($49,316, a difference of 0.29%), and Immigrants from Bolivia ($48,970, a difference of 0.41%).
| Demographics | Rating | Rank | Per Capita Income |
| Immigrants | Romania | 99.9 /100 | #67 | Exceptional $49,463 |
| Lithuanians | 99.8 /100 | #68 | Exceptional $49,448 |
| Immigrants | Canada | 99.8 /100 | #69 | Exceptional $49,412 |
| Immigrants | Eastern Europe | 99.8 /100 | #70 | Exceptional $49,316 |
| Greeks | 99.8 /100 | #71 | Exceptional $49,309 |
| Immigrants | Hungary | 99.8 /100 | #72 | Exceptional $49,303 |
| Immigrants | North America | 99.8 /100 | #73 | Exceptional $49,302 |
| Mongolians | 99.8 /100 | #74 | Exceptional $49,173 |
| Immigrants | Bolivia | 99.7 /100 | #75 | Exceptional $48,970 |
| Immigrants | England | 99.7 /100 | #76 | Exceptional $48,844 |
| Immigrants | Kazakhstan | 99.7 /100 | #77 | Exceptional $48,747 |
| Immigrants | Italy | 99.6 /100 | #78 | Exceptional $48,654 |
| Romanians | 99.5 /100 | #79 | Exceptional $48,445 |
| Egyptians | 99.5 /100 | #80 | Exceptional $48,358 |
| Armenians | 99.4 /100 | #81 | Exceptional $48,287 |