Guatemalan vs Immigrants from Philippines Median Male Earnings
COMPARE
Guatemalan
Immigrants from Philippines
Median Male Earnings
Median Male Earnings Comparison
Guatemalans
Immigrants from Philippines
$46,736
MEDIAN MALE EARNINGS
0.0/ 100
METRIC RATING
305th/ 347
METRIC RANK
$55,809
MEDIAN MALE EARNINGS
78.4/ 100
METRIC RATING
147th/ 347
METRIC RANK
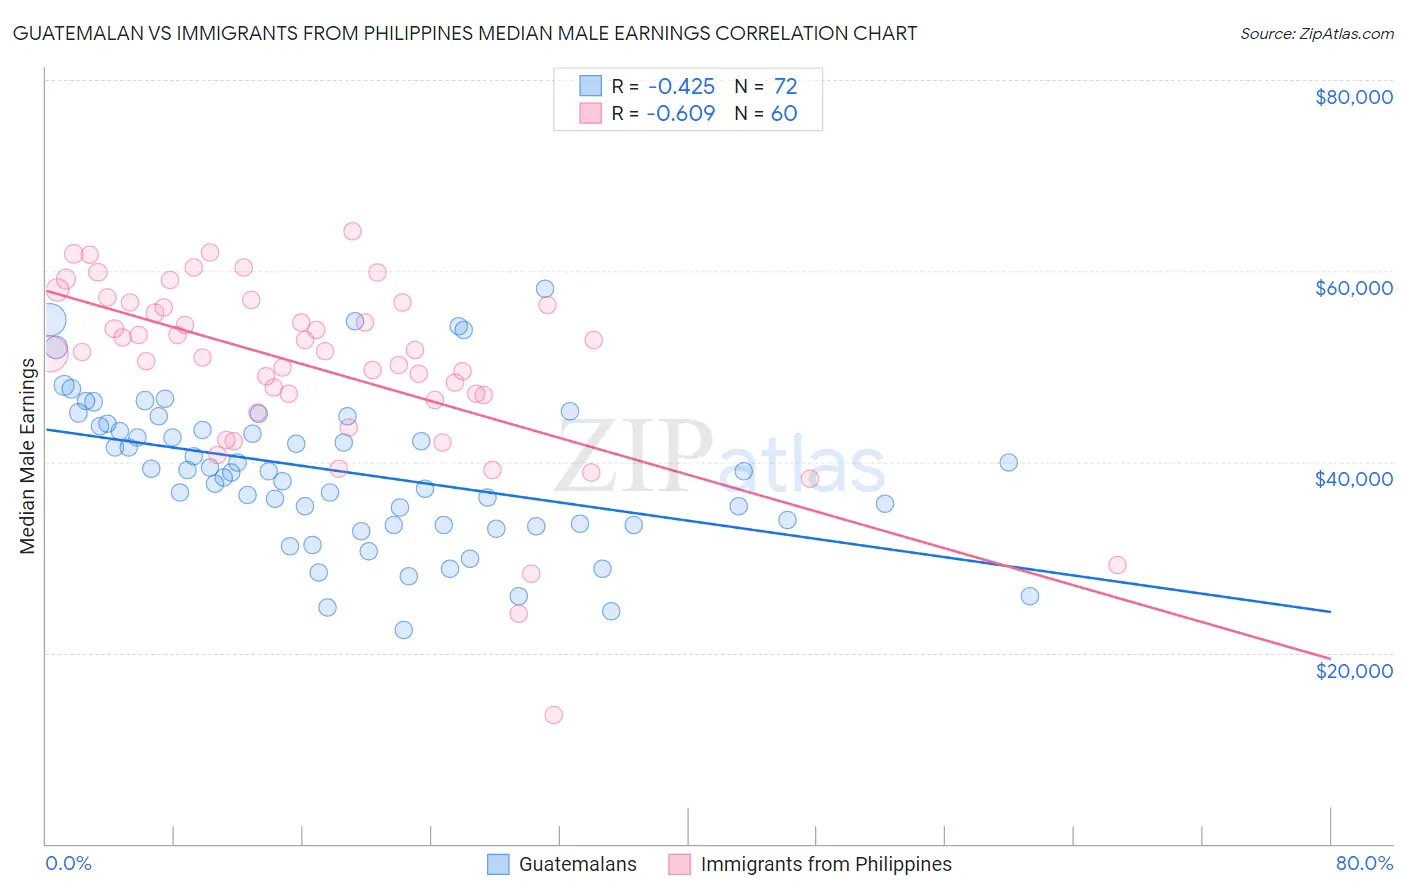
Guatemalan vs Immigrants from Philippines Median Male Earnings Correlation Chart
The statistical analysis conducted on geographies consisting of 409,446,207 people shows a moderate negative correlation between the proportion of Guatemalans and median male earnings in the United States with a correlation coefficient (R) of -0.425 and weighted average of $46,736. Similarly, the statistical analysis conducted on geographies consisting of 471,105,700 people shows a significant negative correlation between the proportion of Immigrants from Philippines and median male earnings in the United States with a correlation coefficient (R) of -0.609 and weighted average of $55,809, a difference of 19.4%.
Median Male Earnings Correlation Summary
| Measurement | Guatemalan | Immigrants from Philippines |
| Minimum | $22,332 | $13,438 |
| Maximum | $58,162 | $64,188 |
| Range | $35,830 | $50,750 |
| Mean | $38,925 | $49,896 |
| Median | $39,033 | $51,541 |
| Interquartile 25% (IQ1) | $33,424 | $46,774 |
| Interquartile 75% (IQ3) | $43,885 | $56,545 |
| Interquartile Range (IQR) | $10,461 | $9,771 |
| Standard Deviation (Sample) | $7,785 | $9,645 |
| Standard Deviation (Population) | $7,731 | $9,565 |
Similar Demographics by Median Male Earnings
Demographics Similar to Guatemalans by Median Male Earnings
In terms of median male earnings, the demographic groups most similar to Guatemalans are Bangladeshi ($46,744, a difference of 0.020%), Yaqui ($46,777, a difference of 0.090%), Seminole ($46,783, a difference of 0.10%), Dutch West Indian ($46,656, a difference of 0.17%), and Immigrants from Dominican Republic ($46,655, a difference of 0.17%).
| Demographics | Rating | Rank | Median Male Earnings |
| Immigrants | Micronesia | 0.1 /100 | #298 | Tragic $47,177 |
| Immigrants | Zaire | 0.1 /100 | #299 | Tragic $47,070 |
| U.S. Virgin Islanders | 0.1 /100 | #300 | Tragic $47,066 |
| Immigrants | Latin America | 0.1 /100 | #301 | Tragic $46,941 |
| Seminole | 0.1 /100 | #302 | Tragic $46,783 |
| Yaqui | 0.1 /100 | #303 | Tragic $46,777 |
| Bangladeshis | 0.1 /100 | #304 | Tragic $46,744 |
| Guatemalans | 0.0 /100 | #305 | Tragic $46,736 |
| Dutch West Indians | 0.0 /100 | #306 | Tragic $46,656 |
| Immigrants | Dominican Republic | 0.0 /100 | #307 | Tragic $46,655 |
| Ottawa | 0.0 /100 | #308 | Tragic $46,611 |
| Creek | 0.0 /100 | #309 | Tragic $46,594 |
| Cubans | 0.0 /100 | #310 | Tragic $46,580 |
| Apache | 0.0 /100 | #311 | Tragic $46,429 |
| Hispanics or Latinos | 0.0 /100 | #312 | Tragic $46,419 |
Demographics Similar to Immigrants from Philippines by Median Male Earnings
In terms of median male earnings, the demographic groups most similar to Immigrants from Philippines are Scottish ($55,793, a difference of 0.030%), English ($55,747, a difference of 0.11%), Swiss ($55,731, a difference of 0.14%), Immigrants from Oceania ($55,712, a difference of 0.17%), and Immigrants from Chile ($55,954, a difference of 0.26%).
| Demographics | Rating | Rank | Median Male Earnings |
| Luxembourgers | 85.5 /100 | #140 | Excellent $56,300 |
| Danes | 84.8 /100 | #141 | Excellent $56,246 |
| Ethiopians | 84.8 /100 | #142 | Excellent $56,243 |
| Sri Lankans | 83.4 /100 | #143 | Excellent $56,136 |
| Immigrants | Uganda | 82.4 /100 | #144 | Excellent $56,064 |
| Norwegians | 80.9 /100 | #145 | Excellent $55,965 |
| Immigrants | Chile | 80.7 /100 | #146 | Excellent $55,954 |
| Immigrants | Philippines | 78.4 /100 | #147 | Good $55,809 |
| Scottish | 78.2 /100 | #148 | Good $55,793 |
| English | 77.4 /100 | #149 | Good $55,747 |
| Swiss | 77.1 /100 | #150 | Good $55,731 |
| Immigrants | Oceania | 76.8 /100 | #151 | Good $55,712 |
| Peruvians | 75.8 /100 | #152 | Good $55,659 |
| Immigrants | Nepal | 75.0 /100 | #153 | Good $55,615 |
| Taiwanese | 73.9 /100 | #154 | Good $55,556 |