Guamanian/Chamorro vs Immigrants from Barbados Median Male Earnings
COMPARE
Guamanian/Chamorro
Immigrants from Barbados
Median Male Earnings
Median Male Earnings Comparison
Guamanians/Chamorros
Immigrants from Barbados
$53,661
MEDIAN MALE EARNINGS
30.7/ 100
METRIC RATING
191st/ 347
METRIC RANK
$50,795
MEDIAN MALE EARNINGS
2.6/ 100
METRIC RATING
237th/ 347
METRIC RANK
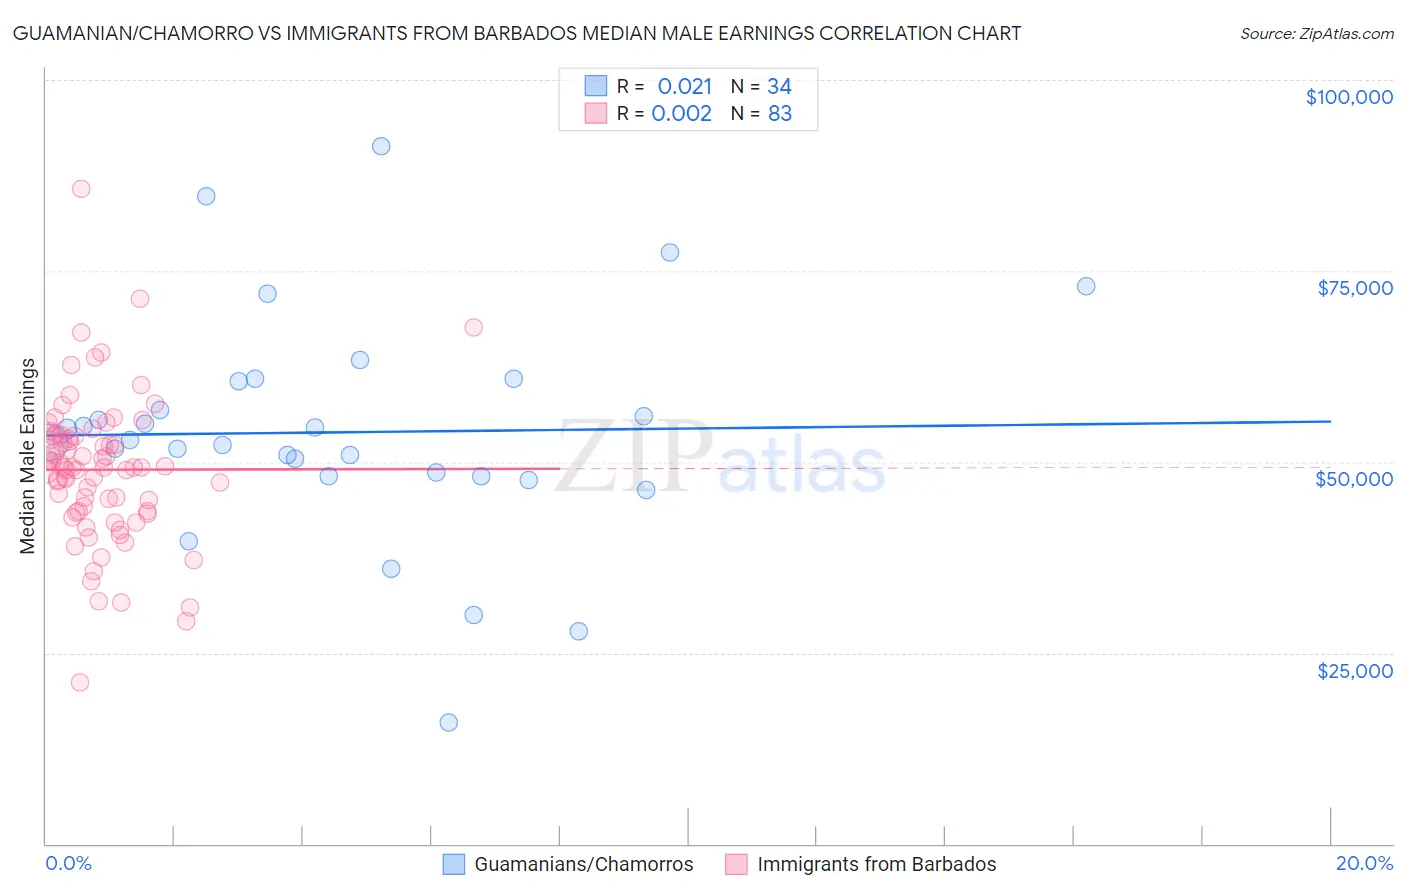
Guamanian/Chamorro vs Immigrants from Barbados Median Male Earnings Correlation Chart
The statistical analysis conducted on geographies consisting of 221,944,725 people shows no correlation between the proportion of Guamanians/Chamorros and median male earnings in the United States with a correlation coefficient (R) of 0.021 and weighted average of $53,661. Similarly, the statistical analysis conducted on geographies consisting of 112,696,118 people shows no correlation between the proportion of Immigrants from Barbados and median male earnings in the United States with a correlation coefficient (R) of 0.002 and weighted average of $50,795, a difference of 5.6%.
Median Male Earnings Correlation Summary
| Measurement | Guamanian/Chamorro | Immigrants from Barbados |
| Minimum | $15,938 | $21,184 |
| Maximum | $91,265 | $85,682 |
| Range | $75,327 | $64,498 |
| Mean | $53,880 | $48,967 |
| Median | $52,699 | $49,260 |
| Interquartile 25% (IQ1) | $48,166 | $43,464 |
| Interquartile 75% (IQ3) | $60,575 | $53,363 |
| Interquartile Range (IQR) | $12,408 | $9,899 |
| Standard Deviation (Sample) | $14,873 | $9,605 |
| Standard Deviation (Population) | $14,653 | $9,547 |
Similar Demographics by Median Male Earnings
Demographics Similar to Guamanians/Chamorros by Median Male Earnings
In terms of median male earnings, the demographic groups most similar to Guamanians/Chamorros are Scotch-Irish ($53,658, a difference of 0.010%), Kenyan ($53,647, a difference of 0.030%), Uruguayan ($53,680, a difference of 0.040%), Puget Sound Salish ($53,704, a difference of 0.080%), and Immigrants from Eritrea ($53,715, a difference of 0.10%).
| Demographics | Rating | Rank | Median Male Earnings |
| Whites/Caucasians | 36.5 /100 | #184 | Fair $53,925 |
| Immigrants | Sierra Leone | 36.0 /100 | #185 | Fair $53,905 |
| Colombians | 34.4 /100 | #186 | Fair $53,832 |
| Immigrants | Eritrea | 31.8 /100 | #187 | Fair $53,715 |
| Immigrants | Eastern Africa | 31.8 /100 | #188 | Fair $53,713 |
| Puget Sound Salish | 31.6 /100 | #189 | Fair $53,704 |
| Uruguayans | 31.1 /100 | #190 | Fair $53,680 |
| Guamanians/Chamorros | 30.7 /100 | #191 | Fair $53,661 |
| Scotch-Irish | 30.6 /100 | #192 | Fair $53,658 |
| Kenyans | 30.4 /100 | #193 | Fair $53,647 |
| Spanish | 29.0 /100 | #194 | Fair $53,576 |
| Immigrants | Azores | 27.5 /100 | #195 | Fair $53,503 |
| Immigrants | Africa | 26.6 /100 | #196 | Fair $53,457 |
| Immigrants | Kenya | 26.0 /100 | #197 | Fair $53,427 |
| Immigrants | Costa Rica | 22.6 /100 | #198 | Fair $53,237 |
Demographics Similar to Immigrants from Barbados by Median Male Earnings
In terms of median male earnings, the demographic groups most similar to Immigrants from Barbados are Malaysian ($50,772, a difference of 0.050%), American ($50,761, a difference of 0.070%), Pennsylvania German ($50,878, a difference of 0.16%), West Indian ($50,682, a difference of 0.22%), and Immigrants from St. Vincent and the Grenadines ($50,665, a difference of 0.26%).
| Demographics | Rating | Rank | Median Male Earnings |
| Immigrants | Nigeria | 4.2 /100 | #230 | Tragic $51,310 |
| Barbadians | 3.9 /100 | #231 | Tragic $51,236 |
| Sudanese | 3.9 /100 | #232 | Tragic $51,216 |
| Aleuts | 3.7 /100 | #233 | Tragic $51,168 |
| Cape Verdeans | 3.5 /100 | #234 | Tragic $51,103 |
| Immigrants | Western Africa | 3.0 /100 | #235 | Tragic $50,940 |
| Pennsylvania Germans | 2.8 /100 | #236 | Tragic $50,878 |
| Immigrants | Barbados | 2.6 /100 | #237 | Tragic $50,795 |
| Malaysians | 2.5 /100 | #238 | Tragic $50,772 |
| Americans | 2.5 /100 | #239 | Tragic $50,761 |
| West Indians | 2.3 /100 | #240 | Tragic $50,682 |
| Immigrants | St. Vincent and the Grenadines | 2.3 /100 | #241 | Tragic $50,665 |
| Guyanese | 2.2 /100 | #242 | Tragic $50,613 |
| French American Indians | 2.2 /100 | #243 | Tragic $50,611 |
| Houma | 2.0 /100 | #244 | Tragic $50,547 |