Guamanian/Chamorro vs Australian Median Male Earnings
COMPARE
Guamanian/Chamorro
Australian
Median Male Earnings
Median Male Earnings Comparison
Guamanians/Chamorros
Australians
$53,661
MEDIAN MALE EARNINGS
30.7/ 100
METRIC RATING
191st/ 347
METRIC RANK
$62,857
MEDIAN MALE EARNINGS
100.0/ 100
METRIC RATING
40th/ 347
METRIC RANK
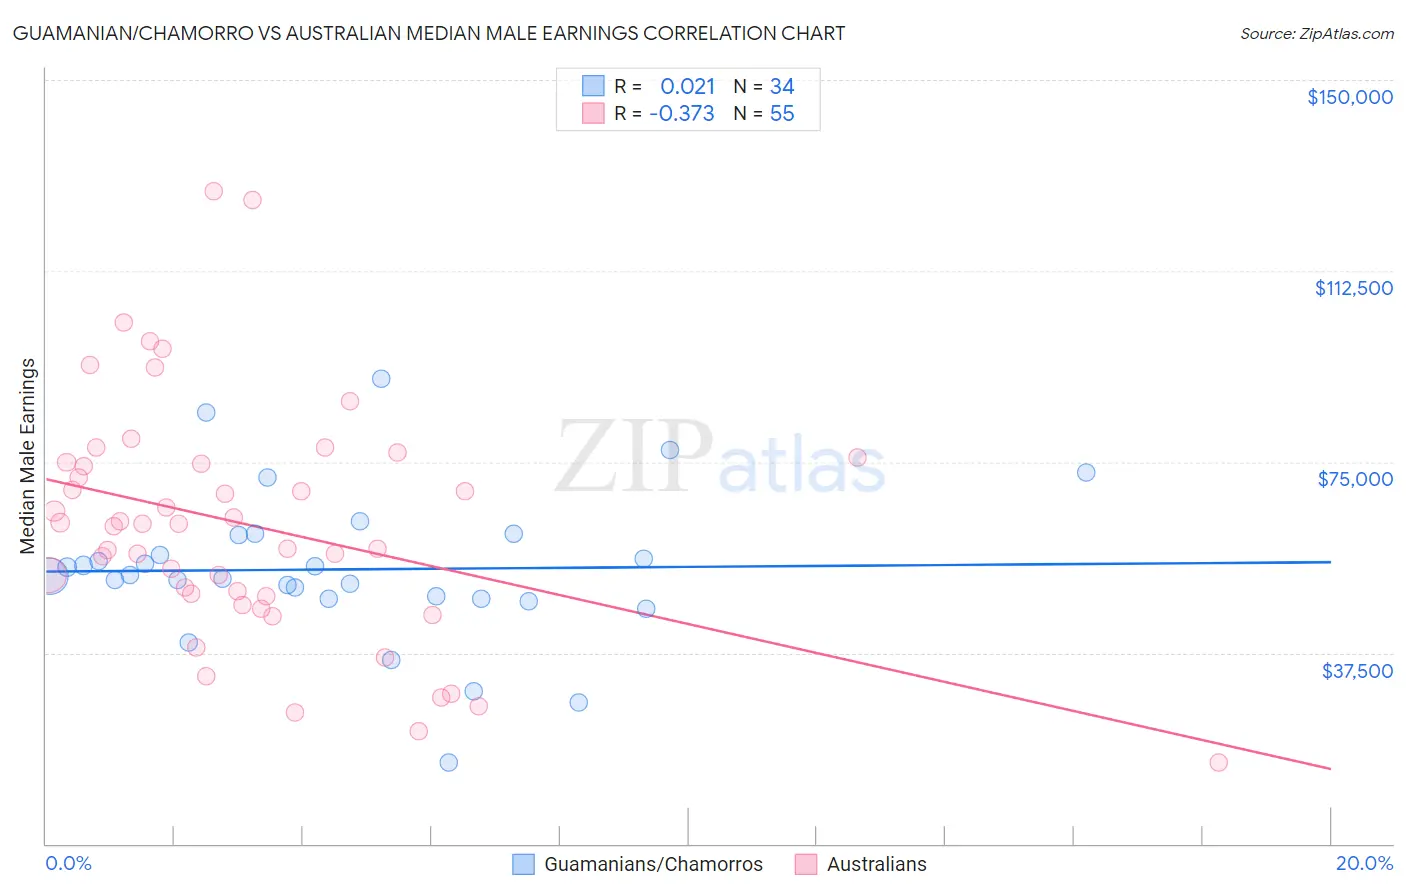
Guamanian/Chamorro vs Australian Median Male Earnings Correlation Chart
The statistical analysis conducted on geographies consisting of 221,944,725 people shows no correlation between the proportion of Guamanians/Chamorros and median male earnings in the United States with a correlation coefficient (R) of 0.021 and weighted average of $53,661. Similarly, the statistical analysis conducted on geographies consisting of 224,135,609 people shows a mild negative correlation between the proportion of Australians and median male earnings in the United States with a correlation coefficient (R) of -0.373 and weighted average of $62,857, a difference of 17.1%.
Median Male Earnings Correlation Summary
| Measurement | Guamanian/Chamorro | Australian |
| Minimum | $15,938 | $15,945 |
| Maximum | $91,265 | $128,097 |
| Range | $75,327 | $112,152 |
| Mean | $53,880 | $62,501 |
| Median | $52,699 | $62,813 |
| Interquartile 25% (IQ1) | $48,166 | $48,594 |
| Interquartile 75% (IQ3) | $60,575 | $74,900 |
| Interquartile Range (IQR) | $12,408 | $26,306 |
| Standard Deviation (Sample) | $14,873 | $23,536 |
| Standard Deviation (Population) | $14,653 | $23,321 |
Similar Demographics by Median Male Earnings
Demographics Similar to Guamanians/Chamorros by Median Male Earnings
In terms of median male earnings, the demographic groups most similar to Guamanians/Chamorros are Scotch-Irish ($53,658, a difference of 0.010%), Kenyan ($53,647, a difference of 0.030%), Uruguayan ($53,680, a difference of 0.040%), Puget Sound Salish ($53,704, a difference of 0.080%), and Immigrants from Eritrea ($53,715, a difference of 0.10%).
| Demographics | Rating | Rank | Median Male Earnings |
| Whites/Caucasians | 36.5 /100 | #184 | Fair $53,925 |
| Immigrants | Sierra Leone | 36.0 /100 | #185 | Fair $53,905 |
| Colombians | 34.4 /100 | #186 | Fair $53,832 |
| Immigrants | Eritrea | 31.8 /100 | #187 | Fair $53,715 |
| Immigrants | Eastern Africa | 31.8 /100 | #188 | Fair $53,713 |
| Puget Sound Salish | 31.6 /100 | #189 | Fair $53,704 |
| Uruguayans | 31.1 /100 | #190 | Fair $53,680 |
| Guamanians/Chamorros | 30.7 /100 | #191 | Fair $53,661 |
| Scotch-Irish | 30.6 /100 | #192 | Fair $53,658 |
| Kenyans | 30.4 /100 | #193 | Fair $53,647 |
| Spanish | 29.0 /100 | #194 | Fair $53,576 |
| Immigrants | Azores | 27.5 /100 | #195 | Fair $53,503 |
| Immigrants | Africa | 26.6 /100 | #196 | Fair $53,457 |
| Immigrants | Kenya | 26.0 /100 | #197 | Fair $53,427 |
| Immigrants | Costa Rica | 22.6 /100 | #198 | Fair $53,237 |
Demographics Similar to Australians by Median Male Earnings
In terms of median male earnings, the demographic groups most similar to Australians are Immigrants from South Africa ($62,899, a difference of 0.070%), Maltese ($62,953, a difference of 0.15%), Immigrants from Turkey ($62,728, a difference of 0.21%), Immigrants from Greece ($62,689, a difference of 0.27%), and Immigrants from Belarus ($62,658, a difference of 0.32%).
| Demographics | Rating | Rank | Median Male Earnings |
| Immigrants | Lithuania | 100.0 /100 | #33 | Exceptional $63,346 |
| Immigrants | Russia | 100.0 /100 | #34 | Exceptional $63,326 |
| Immigrants | Asia | 100.0 /100 | #35 | Exceptional $63,240 |
| Israelis | 100.0 /100 | #36 | Exceptional $63,228 |
| Immigrants | Sri Lanka | 100.0 /100 | #37 | Exceptional $63,099 |
| Maltese | 100.0 /100 | #38 | Exceptional $62,953 |
| Immigrants | South Africa | 100.0 /100 | #39 | Exceptional $62,899 |
| Australians | 100.0 /100 | #40 | Exceptional $62,857 |
| Immigrants | Turkey | 100.0 /100 | #41 | Exceptional $62,728 |
| Immigrants | Greece | 100.0 /100 | #42 | Exceptional $62,689 |
| Immigrants | Belarus | 100.0 /100 | #43 | Exceptional $62,658 |
| Cambodians | 100.0 /100 | #44 | Exceptional $62,516 |
| Bulgarians | 100.0 /100 | #45 | Exceptional $62,378 |
| Immigrants | Czechoslovakia | 99.9 /100 | #46 | Exceptional $62,217 |
| Immigrants | Austria | 99.9 /100 | #47 | Exceptional $62,164 |