Dutch vs Tongan Per Capita Income
COMPARE
Dutch
Tongan
Per Capita Income
Per Capita Income Comparison
Dutch
Tongans
$42,605
PER CAPITA INCOME
23.4/ 100
METRIC RATING
196th/ 347
METRIC RANK
$41,693
PER CAPITA INCOME
9.9/ 100
METRIC RATING
216th/ 347
METRIC RANK
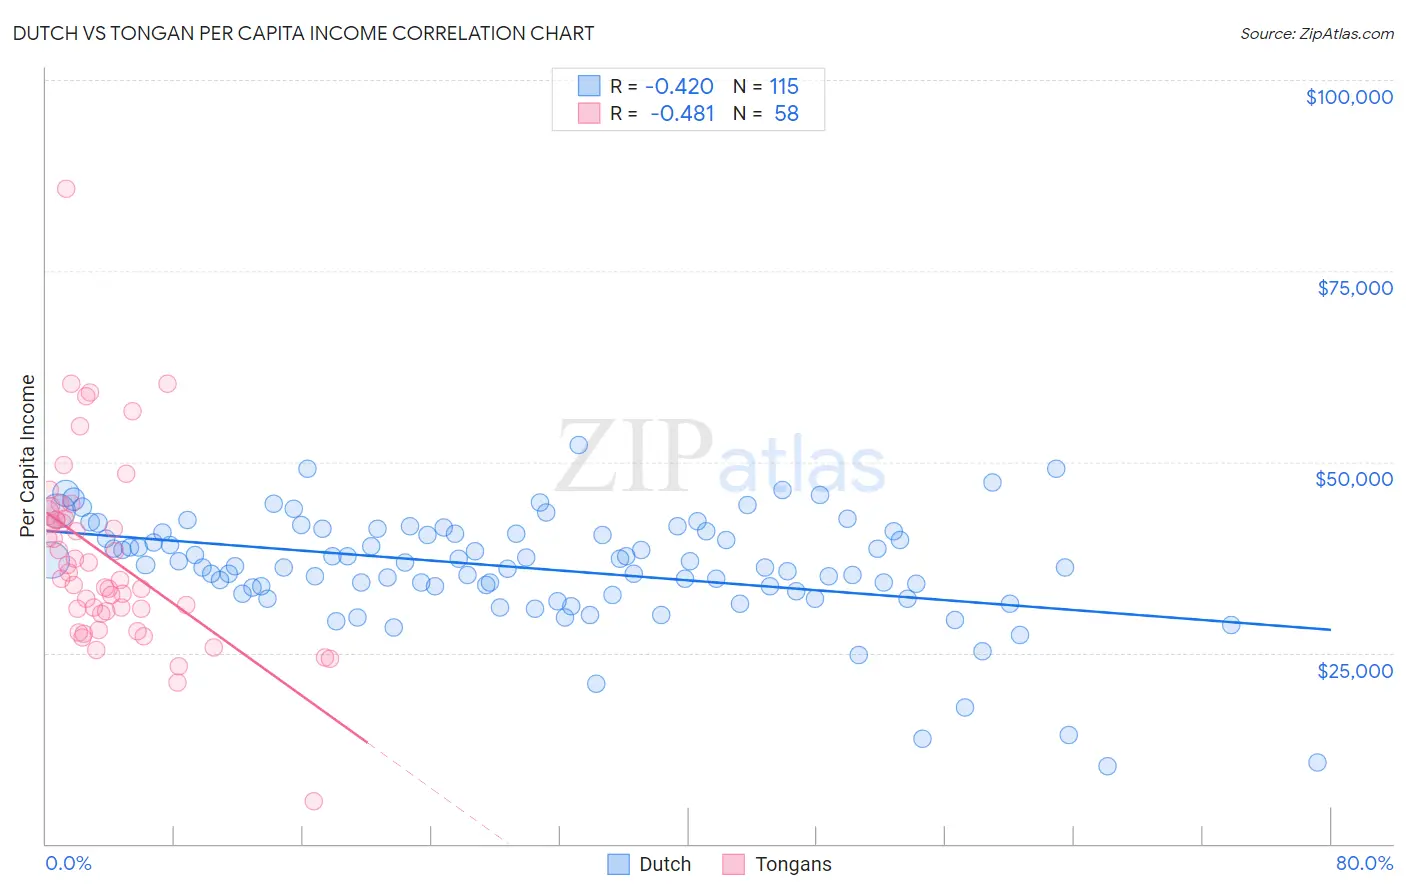
Dutch vs Tongan Per Capita Income Correlation Chart
The statistical analysis conducted on geographies consisting of 554,404,949 people shows a moderate negative correlation between the proportion of Dutch and per capita income in the United States with a correlation coefficient (R) of -0.420 and weighted average of $42,605. Similarly, the statistical analysis conducted on geographies consisting of 102,908,385 people shows a moderate negative correlation between the proportion of Tongans and per capita income in the United States with a correlation coefficient (R) of -0.481 and weighted average of $41,693, a difference of 2.2%.
Per Capita Income Correlation Summary
| Measurement | Dutch | Tongan |
| Minimum | $10,108 | $5,622 |
| Maximum | $52,150 | $85,704 |
| Range | $42,042 | $80,082 |
| Mean | $36,061 | $37,644 |
| Median | $36,441 | $35,100 |
| Interquartile 25% (IQ1) | $33,045 | $30,397 |
| Interquartile 75% (IQ3) | $40,758 | $42,507 |
| Interquartile Range (IQR) | $7,713 | $12,110 |
| Standard Deviation (Sample) | $7,274 | $12,429 |
| Standard Deviation (Population) | $7,242 | $12,321 |
Demographics Similar to Dutch and Tongans by Per Capita Income
In terms of per capita income, the demographic groups most similar to Dutch are Scotch-Irish ($42,563, a difference of 0.10%), Immigrants from Portugal ($42,412, a difference of 0.46%), Barbadian ($42,406, a difference of 0.47%), Vietnamese ($42,368, a difference of 0.56%), and Immigrants from Thailand ($42,289, a difference of 0.75%). Similarly, the demographic groups most similar to Tongans are Sudanese ($41,695, a difference of 0.010%), Immigrants from Bangladesh ($41,709, a difference of 0.040%), Immigrants from Venezuela ($41,727, a difference of 0.080%), Immigrants from Senegal ($41,830, a difference of 0.33%), and Immigrants from Panama ($41,853, a difference of 0.38%).
| Demographics | Rating | Rank | Per Capita Income |
| Dutch | 23.4 /100 | #196 | Fair $42,605 |
| Scotch-Irish | 22.6 /100 | #197 | Fair $42,563 |
| Immigrants | Portugal | 19.7 /100 | #198 | Poor $42,412 |
| Barbadians | 19.6 /100 | #199 | Poor $42,406 |
| Vietnamese | 19.0 /100 | #200 | Poor $42,368 |
| Immigrants | Thailand | 17.6 /100 | #201 | Poor $42,289 |
| Immigrants | Bosnia and Herzegovina | 17.5 /100 | #202 | Poor $42,278 |
| Spanish | 17.0 /100 | #203 | Poor $42,249 |
| Aleuts | 16.4 /100 | #204 | Poor $42,210 |
| Whites/Caucasians | 15.9 /100 | #205 | Poor $42,180 |
| Ghanaians | 15.7 /100 | #206 | Poor $42,164 |
| Venezuelans | 14.4 /100 | #207 | Poor $42,074 |
| Panamanians | 13.9 /100 | #208 | Poor $42,035 |
| Immigrants | Sudan | 13.2 /100 | #209 | Poor $41,986 |
| Ecuadorians | 12.9 /100 | #210 | Poor $41,958 |
| Immigrants | Panama | 11.6 /100 | #211 | Poor $41,853 |
| Immigrants | Senegal | 11.3 /100 | #212 | Poor $41,830 |
| Immigrants | Venezuela | 10.2 /100 | #213 | Poor $41,727 |
| Immigrants | Bangladesh | 10.1 /100 | #214 | Poor $41,709 |
| Sudanese | 9.9 /100 | #215 | Tragic $41,695 |
| Tongans | 9.9 /100 | #216 | Tragic $41,693 |