Dutch vs Immigrants from Bahamas Per Capita Income
COMPARE
Dutch
Immigrants from Bahamas
Per Capita Income
Per Capita Income Comparison
Dutch
Immigrants from Bahamas
$42,605
PER CAPITA INCOME
23.4/ 100
METRIC RATING
196th/ 347
METRIC RANK
$37,193
PER CAPITA INCOME
0.1/ 100
METRIC RATING
300th/ 347
METRIC RANK
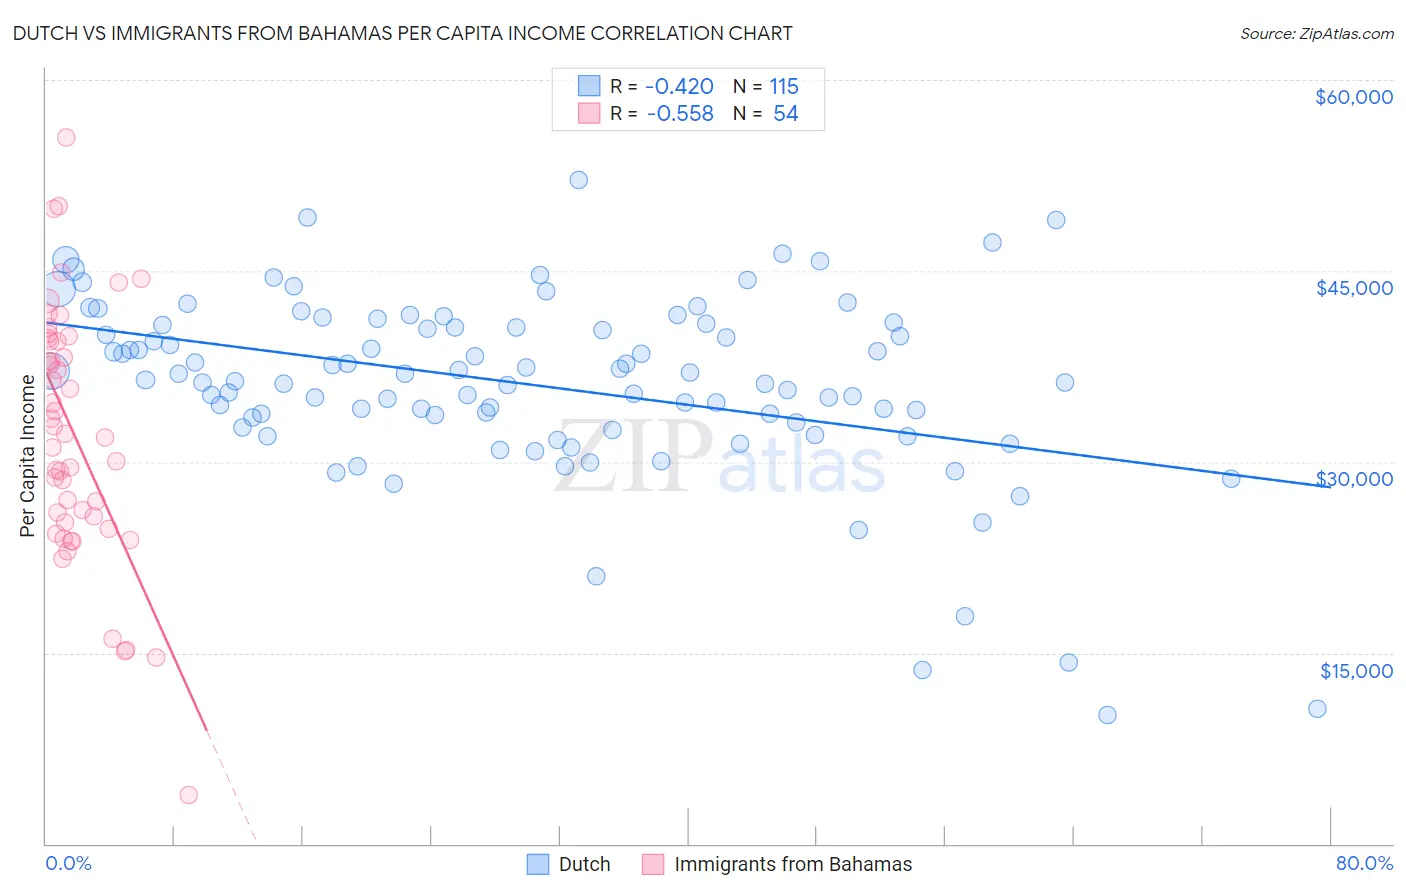
Dutch vs Immigrants from Bahamas Per Capita Income Correlation Chart
The statistical analysis conducted on geographies consisting of 554,404,949 people shows a moderate negative correlation between the proportion of Dutch and per capita income in the United States with a correlation coefficient (R) of -0.420 and weighted average of $42,605. Similarly, the statistical analysis conducted on geographies consisting of 104,665,550 people shows a substantial negative correlation between the proportion of Immigrants from Bahamas and per capita income in the United States with a correlation coefficient (R) of -0.558 and weighted average of $37,193, a difference of 14.5%.
Per Capita Income Correlation Summary
| Measurement | Dutch | Immigrants from Bahamas |
| Minimum | $10,108 | $3,864 |
| Maximum | $52,150 | $55,468 |
| Range | $42,042 | $51,604 |
| Mean | $36,061 | $32,077 |
| Median | $36,441 | $32,055 |
| Interquartile 25% (IQ1) | $33,045 | $25,247 |
| Interquartile 75% (IQ3) | $40,758 | $39,474 |
| Interquartile Range (IQR) | $7,713 | $14,227 |
| Standard Deviation (Sample) | $7,274 | $9,963 |
| Standard Deviation (Population) | $7,242 | $9,870 |
Similar Demographics by Per Capita Income
Demographics Similar to Dutch by Per Capita Income
In terms of per capita income, the demographic groups most similar to Dutch are Scotch-Irish ($42,563, a difference of 0.10%), Immigrants from Kenya ($42,661, a difference of 0.13%), Immigrants from Fiji ($42,694, a difference of 0.21%), Immigrants from Sierra Leone ($42,752, a difference of 0.34%), and Iraqi ($42,760, a difference of 0.36%).
| Demographics | Rating | Rank | Per Capita Income |
| Bermudans | 30.1 /100 | #189 | Fair $42,911 |
| Kenyans | 27.7 /100 | #190 | Fair $42,808 |
| Yugoslavians | 27.4 /100 | #191 | Fair $42,792 |
| Iraqis | 26.7 /100 | #192 | Fair $42,760 |
| Immigrants | Sierra Leone | 26.5 /100 | #193 | Fair $42,752 |
| Immigrants | Fiji | 25.2 /100 | #194 | Fair $42,694 |
| Immigrants | Kenya | 24.5 /100 | #195 | Fair $42,661 |
| Dutch | 23.4 /100 | #196 | Fair $42,605 |
| Scotch-Irish | 22.6 /100 | #197 | Fair $42,563 |
| Immigrants | Portugal | 19.7 /100 | #198 | Poor $42,412 |
| Barbadians | 19.6 /100 | #199 | Poor $42,406 |
| Vietnamese | 19.0 /100 | #200 | Poor $42,368 |
| Immigrants | Thailand | 17.6 /100 | #201 | Poor $42,289 |
| Immigrants | Bosnia and Herzegovina | 17.5 /100 | #202 | Poor $42,278 |
| Spanish | 17.0 /100 | #203 | Poor $42,249 |
Demographics Similar to Immigrants from Bahamas by Per Capita Income
In terms of per capita income, the demographic groups most similar to Immigrants from Bahamas are Cherokee ($37,203, a difference of 0.030%), Immigrants from Caribbean ($37,254, a difference of 0.17%), Ottawa ($37,101, a difference of 0.25%), Haitian ($37,289, a difference of 0.26%), and Indonesian ($37,300, a difference of 0.29%).
| Demographics | Rating | Rank | Per Capita Income |
| Mexican American Indians | 0.1 /100 | #293 | Tragic $37,407 |
| Cubans | 0.1 /100 | #294 | Tragic $37,383 |
| Immigrants | Dominican Republic | 0.1 /100 | #295 | Tragic $37,306 |
| Indonesians | 0.1 /100 | #296 | Tragic $37,300 |
| Haitians | 0.1 /100 | #297 | Tragic $37,289 |
| Immigrants | Caribbean | 0.1 /100 | #298 | Tragic $37,254 |
| Cherokee | 0.1 /100 | #299 | Tragic $37,203 |
| Immigrants | Bahamas | 0.1 /100 | #300 | Tragic $37,193 |
| Ottawa | 0.1 /100 | #301 | Tragic $37,101 |
| Shoshone | 0.1 /100 | #302 | Tragic $37,072 |
| Paiute | 0.1 /100 | #303 | Tragic $37,066 |
| Hondurans | 0.1 /100 | #304 | Tragic $37,031 |
| Inupiat | 0.1 /100 | #305 | Tragic $36,999 |
| Immigrants | Haiti | 0.0 /100 | #306 | Tragic $36,849 |
| Immigrants | Latin America | 0.0 /100 | #307 | Tragic $36,823 |