Dutch vs Immigrants from Uzbekistan Per Capita Income
COMPARE
Dutch
Immigrants from Uzbekistan
Per Capita Income
Per Capita Income Comparison
Dutch
Immigrants from Uzbekistan
$42,605
PER CAPITA INCOME
23.4/ 100
METRIC RATING
196th/ 347
METRIC RANK
$46,929
PER CAPITA INCOME
97.5/ 100
METRIC RATING
101st/ 347
METRIC RANK
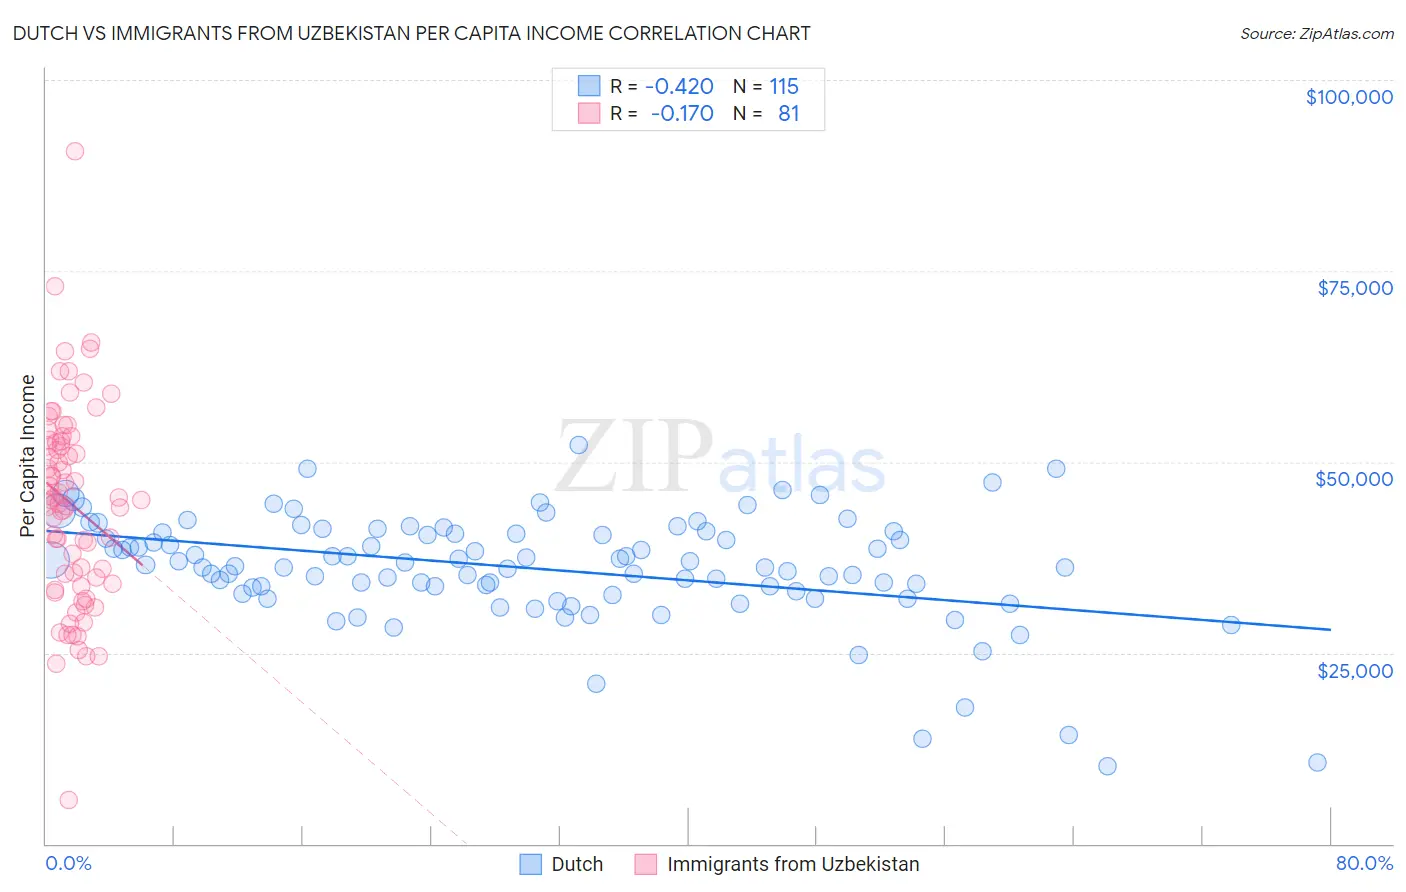
Dutch vs Immigrants from Uzbekistan Per Capita Income Correlation Chart
The statistical analysis conducted on geographies consisting of 554,404,949 people shows a moderate negative correlation between the proportion of Dutch and per capita income in the United States with a correlation coefficient (R) of -0.420 and weighted average of $42,605. Similarly, the statistical analysis conducted on geographies consisting of 118,766,454 people shows a poor negative correlation between the proportion of Immigrants from Uzbekistan and per capita income in the United States with a correlation coefficient (R) of -0.170 and weighted average of $46,929, a difference of 10.2%.
Per Capita Income Correlation Summary
| Measurement | Dutch | Immigrants from Uzbekistan |
| Minimum | $10,108 | $5,747 |
| Maximum | $52,150 | $90,679 |
| Range | $42,042 | $84,932 |
| Mean | $36,061 | $44,513 |
| Median | $36,441 | $45,080 |
| Interquartile 25% (IQ1) | $33,045 | $34,402 |
| Interquartile 75% (IQ3) | $40,758 | $52,838 |
| Interquartile Range (IQR) | $7,713 | $18,436 |
| Standard Deviation (Sample) | $7,274 | $13,145 |
| Standard Deviation (Population) | $7,242 | $13,064 |
Similar Demographics by Per Capita Income
Demographics Similar to Dutch by Per Capita Income
In terms of per capita income, the demographic groups most similar to Dutch are Scotch-Irish ($42,563, a difference of 0.10%), Immigrants from Kenya ($42,661, a difference of 0.13%), Immigrants from Fiji ($42,694, a difference of 0.21%), Immigrants from Sierra Leone ($42,752, a difference of 0.34%), and Iraqi ($42,760, a difference of 0.36%).
| Demographics | Rating | Rank | Per Capita Income |
| Bermudans | 30.1 /100 | #189 | Fair $42,911 |
| Kenyans | 27.7 /100 | #190 | Fair $42,808 |
| Yugoslavians | 27.4 /100 | #191 | Fair $42,792 |
| Iraqis | 26.7 /100 | #192 | Fair $42,760 |
| Immigrants | Sierra Leone | 26.5 /100 | #193 | Fair $42,752 |
| Immigrants | Fiji | 25.2 /100 | #194 | Fair $42,694 |
| Immigrants | Kenya | 24.5 /100 | #195 | Fair $42,661 |
| Dutch | 23.4 /100 | #196 | Fair $42,605 |
| Scotch-Irish | 22.6 /100 | #197 | Fair $42,563 |
| Immigrants | Portugal | 19.7 /100 | #198 | Poor $42,412 |
| Barbadians | 19.6 /100 | #199 | Poor $42,406 |
| Vietnamese | 19.0 /100 | #200 | Poor $42,368 |
| Immigrants | Thailand | 17.6 /100 | #201 | Poor $42,289 |
| Immigrants | Bosnia and Herzegovina | 17.5 /100 | #202 | Poor $42,278 |
| Spanish | 17.0 /100 | #203 | Poor $42,249 |
Demographics Similar to Immigrants from Uzbekistan by Per Capita Income
In terms of per capita income, the demographic groups most similar to Immigrants from Uzbekistan are Immigrants from Lebanon ($46,938, a difference of 0.020%), Immigrants from Western Asia ($46,876, a difference of 0.11%), Syrian ($46,837, a difference of 0.20%), Laotian ($47,041, a difference of 0.24%), and Immigrants from Pakistan ($47,084, a difference of 0.33%).
| Demographics | Rating | Rank | Per Capita Income |
| Albanians | 98.5 /100 | #94 | Exceptional $47,379 |
| Immigrants | Egypt | 98.5 /100 | #95 | Exceptional $47,361 |
| Alsatians | 98.3 /100 | #96 | Exceptional $47,284 |
| Carpatho Rusyns | 98.2 /100 | #97 | Exceptional $47,248 |
| Immigrants | Pakistan | 97.9 /100 | #98 | Exceptional $47,084 |
| Laotians | 97.8 /100 | #99 | Exceptional $47,041 |
| Immigrants | Lebanon | 97.5 /100 | #100 | Exceptional $46,938 |
| Immigrants | Uzbekistan | 97.5 /100 | #101 | Exceptional $46,929 |
| Immigrants | Western Asia | 97.4 /100 | #102 | Exceptional $46,876 |
| Syrians | 97.2 /100 | #103 | Exceptional $46,837 |
| Brazilians | 96.8 /100 | #104 | Exceptional $46,700 |
| British | 96.3 /100 | #105 | Exceptional $46,571 |
| Ethiopians | 96.3 /100 | #106 | Exceptional $46,569 |
| Serbians | 96.2 /100 | #107 | Exceptional $46,551 |
| Immigrants | Kuwait | 96.2 /100 | #108 | Exceptional $46,543 |