Dutch vs Central American Indian Per Capita Income
COMPARE
Dutch
Central American Indian
Per Capita Income
Per Capita Income Comparison
Dutch
Central American Indians
$42,605
PER CAPITA INCOME
23.4/ 100
METRIC RATING
196th/ 347
METRIC RANK
$37,699
PER CAPITA INCOME
0.1/ 100
METRIC RATING
286th/ 347
METRIC RANK
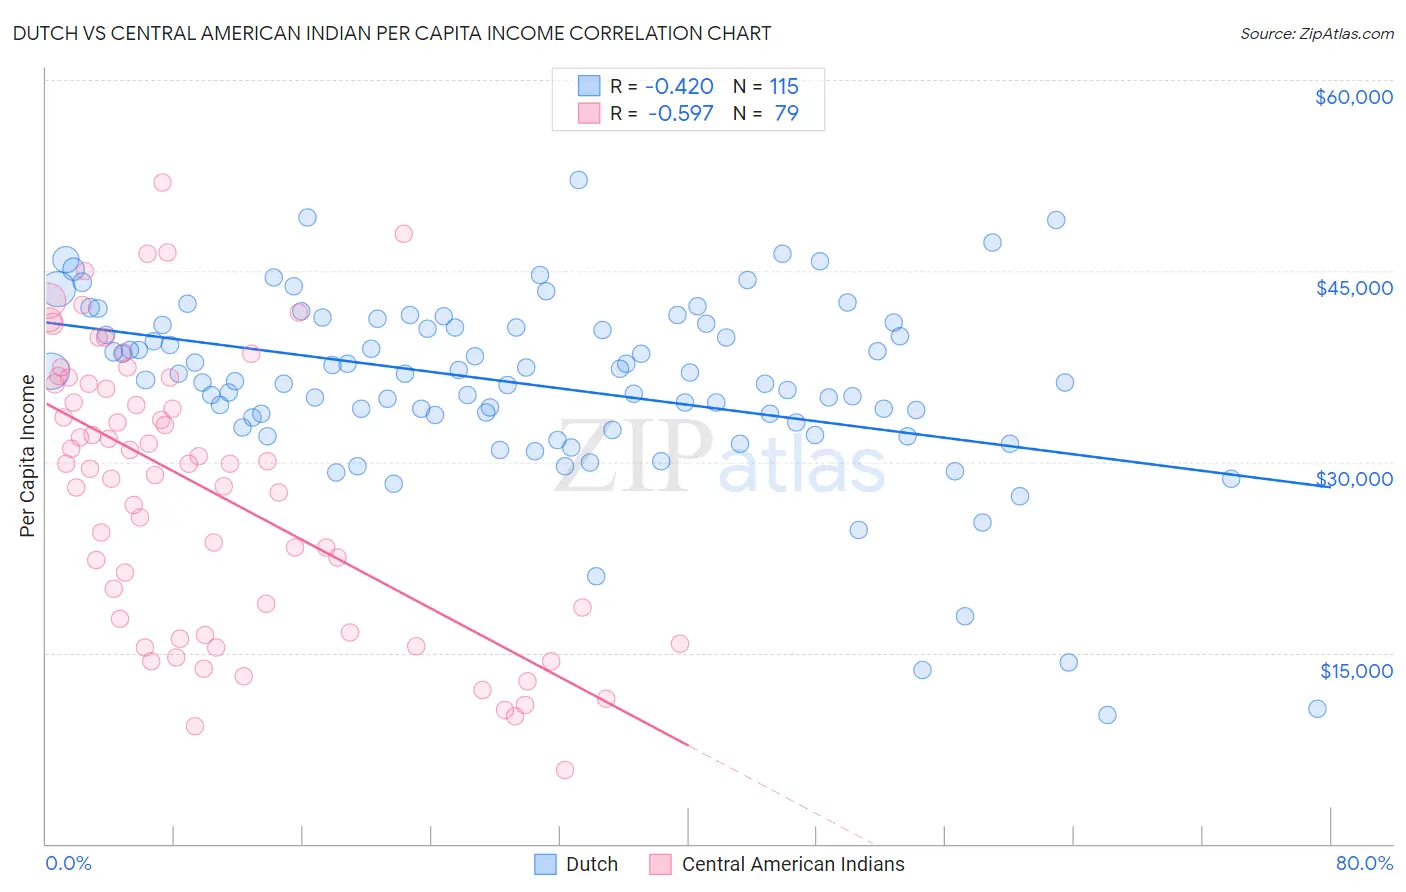
Dutch vs Central American Indian Per Capita Income Correlation Chart
The statistical analysis conducted on geographies consisting of 554,404,949 people shows a moderate negative correlation between the proportion of Dutch and per capita income in the United States with a correlation coefficient (R) of -0.420 and weighted average of $42,605. Similarly, the statistical analysis conducted on geographies consisting of 326,146,034 people shows a substantial negative correlation between the proportion of Central American Indians and per capita income in the United States with a correlation coefficient (R) of -0.597 and weighted average of $37,699, a difference of 13.0%.
Per Capita Income Correlation Summary
| Measurement | Dutch | Central American Indian |
| Minimum | $10,108 | $5,814 |
| Maximum | $52,150 | $51,916 |
| Range | $42,042 | $46,102 |
| Mean | $36,061 | $27,773 |
| Median | $36,441 | $29,805 |
| Interquartile 25% (IQ1) | $33,045 | $16,640 |
| Interquartile 75% (IQ3) | $40,758 | $36,169 |
| Interquartile Range (IQR) | $7,713 | $19,529 |
| Standard Deviation (Sample) | $7,274 | $10,964 |
| Standard Deviation (Population) | $7,242 | $10,894 |
Similar Demographics by Per Capita Income
Demographics Similar to Dutch by Per Capita Income
In terms of per capita income, the demographic groups most similar to Dutch are Scotch-Irish ($42,563, a difference of 0.10%), Immigrants from Kenya ($42,661, a difference of 0.13%), Immigrants from Fiji ($42,694, a difference of 0.21%), Immigrants from Sierra Leone ($42,752, a difference of 0.34%), and Iraqi ($42,760, a difference of 0.36%).
| Demographics | Rating | Rank | Per Capita Income |
| Bermudans | 30.1 /100 | #189 | Fair $42,911 |
| Kenyans | 27.7 /100 | #190 | Fair $42,808 |
| Yugoslavians | 27.4 /100 | #191 | Fair $42,792 |
| Iraqis | 26.7 /100 | #192 | Fair $42,760 |
| Immigrants | Sierra Leone | 26.5 /100 | #193 | Fair $42,752 |
| Immigrants | Fiji | 25.2 /100 | #194 | Fair $42,694 |
| Immigrants | Kenya | 24.5 /100 | #195 | Fair $42,661 |
| Dutch | 23.4 /100 | #196 | Fair $42,605 |
| Scotch-Irish | 22.6 /100 | #197 | Fair $42,563 |
| Immigrants | Portugal | 19.7 /100 | #198 | Poor $42,412 |
| Barbadians | 19.6 /100 | #199 | Poor $42,406 |
| Vietnamese | 19.0 /100 | #200 | Poor $42,368 |
| Immigrants | Thailand | 17.6 /100 | #201 | Poor $42,289 |
| Immigrants | Bosnia and Herzegovina | 17.5 /100 | #202 | Poor $42,278 |
| Spanish | 17.0 /100 | #203 | Poor $42,249 |
Demographics Similar to Central American Indians by Per Capita Income
In terms of per capita income, the demographic groups most similar to Central American Indians are Dominican ($37,697, a difference of 0.010%), Blackfeet ($37,695, a difference of 0.010%), Guatemalan ($37,766, a difference of 0.18%), African ($37,785, a difference of 0.23%), and U.S. Virgin Islander ($37,589, a difference of 0.29%).
| Demographics | Rating | Rank | Per Capita Income |
| Colville | 0.2 /100 | #279 | Tragic $38,047 |
| Potawatomi | 0.2 /100 | #280 | Tragic $38,046 |
| Immigrants | Dominica | 0.2 /100 | #281 | Tragic $37,952 |
| Immigrants | Laos | 0.1 /100 | #282 | Tragic $37,857 |
| Pennsylvania Germans | 0.1 /100 | #283 | Tragic $37,842 |
| Africans | 0.1 /100 | #284 | Tragic $37,785 |
| Guatemalans | 0.1 /100 | #285 | Tragic $37,766 |
| Central American Indians | 0.1 /100 | #286 | Tragic $37,699 |
| Dominicans | 0.1 /100 | #287 | Tragic $37,697 |
| Blackfeet | 0.1 /100 | #288 | Tragic $37,695 |
| U.S. Virgin Islanders | 0.1 /100 | #289 | Tragic $37,589 |
| Immigrants | Guatemala | 0.1 /100 | #290 | Tragic $37,550 |
| Cajuns | 0.1 /100 | #291 | Tragic $37,527 |
| Immigrants | Micronesia | 0.1 /100 | #292 | Tragic $37,464 |
| Mexican American Indians | 0.1 /100 | #293 | Tragic $37,407 |