Dutch vs South African Per Capita Income
COMPARE
Dutch
South African
Per Capita Income
Per Capita Income Comparison
Dutch
South Africans
$42,605
PER CAPITA INCOME
23.4/ 100
METRIC RATING
196th/ 347
METRIC RANK
$50,044
PER CAPITA INCOME
99.9/ 100
METRIC RATING
57th/ 347
METRIC RANK
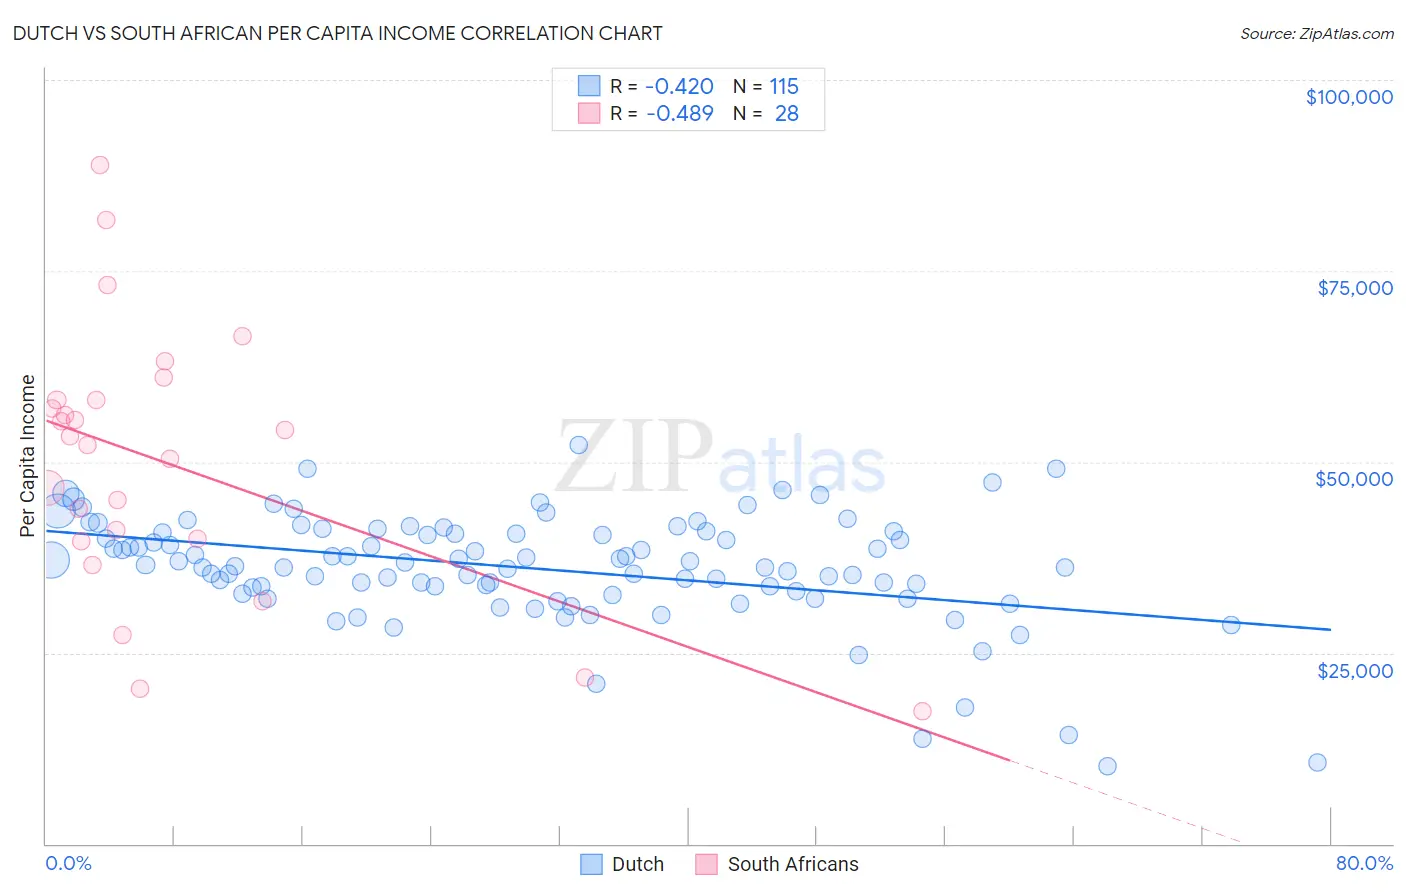
Dutch vs South African Per Capita Income Correlation Chart
The statistical analysis conducted on geographies consisting of 554,404,949 people shows a moderate negative correlation between the proportion of Dutch and per capita income in the United States with a correlation coefficient (R) of -0.420 and weighted average of $42,605. Similarly, the statistical analysis conducted on geographies consisting of 182,604,546 people shows a moderate negative correlation between the proportion of South Africans and per capita income in the United States with a correlation coefficient (R) of -0.489 and weighted average of $50,044, a difference of 17.5%.
Per Capita Income Correlation Summary
| Measurement | Dutch | South African |
| Minimum | $10,108 | $17,364 |
| Maximum | $52,150 | $88,818 |
| Range | $42,042 | $71,454 |
| Mean | $36,061 | $49,855 |
| Median | $36,441 | $52,728 |
| Interquartile 25% (IQ1) | $33,045 | $39,824 |
| Interquartile 75% (IQ3) | $40,758 | $58,137 |
| Interquartile Range (IQR) | $7,713 | $18,313 |
| Standard Deviation (Sample) | $7,274 | $17,281 |
| Standard Deviation (Population) | $7,242 | $16,970 |
Similar Demographics by Per Capita Income
Demographics Similar to Dutch by Per Capita Income
In terms of per capita income, the demographic groups most similar to Dutch are Scotch-Irish ($42,563, a difference of 0.10%), Immigrants from Kenya ($42,661, a difference of 0.13%), Immigrants from Fiji ($42,694, a difference of 0.21%), Immigrants from Sierra Leone ($42,752, a difference of 0.34%), and Iraqi ($42,760, a difference of 0.36%).
| Demographics | Rating | Rank | Per Capita Income |
| Bermudans | 30.1 /100 | #189 | Fair $42,911 |
| Kenyans | 27.7 /100 | #190 | Fair $42,808 |
| Yugoslavians | 27.4 /100 | #191 | Fair $42,792 |
| Iraqis | 26.7 /100 | #192 | Fair $42,760 |
| Immigrants | Sierra Leone | 26.5 /100 | #193 | Fair $42,752 |
| Immigrants | Fiji | 25.2 /100 | #194 | Fair $42,694 |
| Immigrants | Kenya | 24.5 /100 | #195 | Fair $42,661 |
| Dutch | 23.4 /100 | #196 | Fair $42,605 |
| Scotch-Irish | 22.6 /100 | #197 | Fair $42,563 |
| Immigrants | Portugal | 19.7 /100 | #198 | Poor $42,412 |
| Barbadians | 19.6 /100 | #199 | Poor $42,406 |
| Vietnamese | 19.0 /100 | #200 | Poor $42,368 |
| Immigrants | Thailand | 17.6 /100 | #201 | Poor $42,289 |
| Immigrants | Bosnia and Herzegovina | 17.5 /100 | #202 | Poor $42,278 |
| Spanish | 17.0 /100 | #203 | Poor $42,249 |
Demographics Similar to South Africans by Per Capita Income
In terms of per capita income, the demographic groups most similar to South Africans are Asian ($50,057, a difference of 0.030%), Immigrants from Western Europe ($50,065, a difference of 0.040%), Immigrants from Malaysia ($49,983, a difference of 0.12%), Bhutanese ($49,894, a difference of 0.30%), and Immigrants from Scotland ($49,893, a difference of 0.30%).
| Demographics | Rating | Rank | Per Capita Income |
| Immigrants | Sri Lanka | 100.0 /100 | #50 | Exceptional $50,555 |
| Immigrants | Netherlands | 100.0 /100 | #51 | Exceptional $50,458 |
| Immigrants | Croatia | 99.9 /100 | #52 | Exceptional $50,417 |
| Paraguayans | 99.9 /100 | #53 | Exceptional $50,385 |
| Immigrants | Belarus | 99.9 /100 | #54 | Exceptional $50,303 |
| Immigrants | Western Europe | 99.9 /100 | #55 | Exceptional $50,065 |
| Asians | 99.9 /100 | #56 | Exceptional $50,057 |
| South Africans | 99.9 /100 | #57 | Exceptional $50,044 |
| Immigrants | Malaysia | 99.9 /100 | #58 | Exceptional $49,983 |
| Bhutanese | 99.9 /100 | #59 | Exceptional $49,894 |
| Immigrants | Scotland | 99.9 /100 | #60 | Exceptional $49,893 |
| Argentineans | 99.9 /100 | #61 | Exceptional $49,862 |
| Immigrants | Asia | 99.9 /100 | #62 | Exceptional $49,741 |
| Maltese | 99.9 /100 | #63 | Exceptional $49,640 |
| Immigrants | Argentina | 99.9 /100 | #64 | Exceptional $49,627 |