Immigrants from West Indies vs Tongan Per Capita Income
COMPARE
Immigrants from West Indies
Tongan
Per Capita Income
Per Capita Income Comparison
Immigrants from West Indies
Tongans
$40,763
PER CAPITA INCOME
3.7/ 100
METRIC RATING
234th/ 347
METRIC RANK
$41,693
PER CAPITA INCOME
9.9/ 100
METRIC RATING
216th/ 347
METRIC RANK
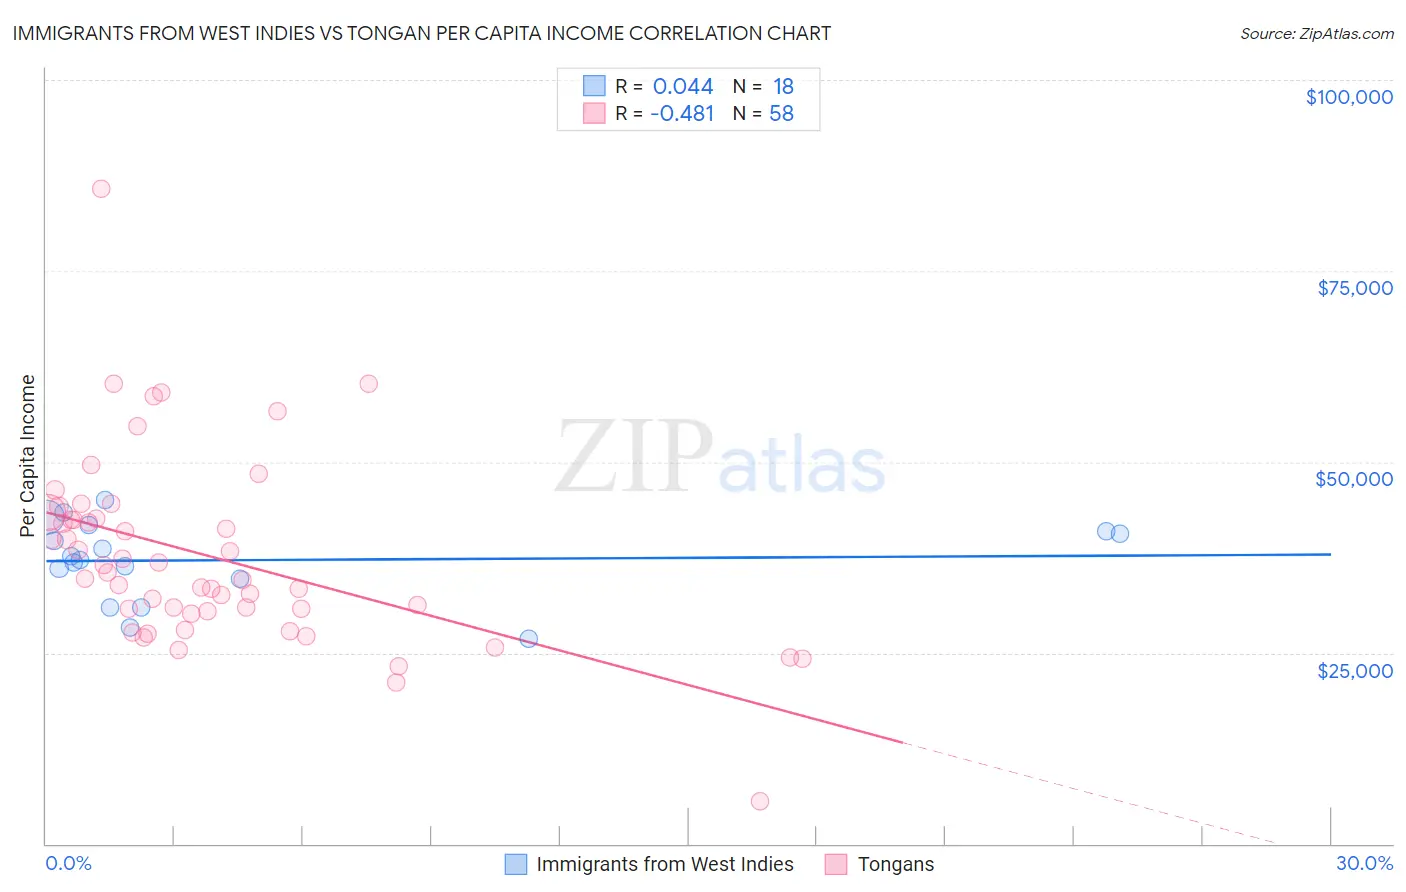
Immigrants from West Indies vs Tongan Per Capita Income Correlation Chart
The statistical analysis conducted on geographies consisting of 72,420,477 people shows no correlation between the proportion of Immigrants from West Indies and per capita income in the United States with a correlation coefficient (R) of 0.044 and weighted average of $40,763. Similarly, the statistical analysis conducted on geographies consisting of 102,908,385 people shows a moderate negative correlation between the proportion of Tongans and per capita income in the United States with a correlation coefficient (R) of -0.481 and weighted average of $41,693, a difference of 2.3%.
Per Capita Income Correlation Summary
| Measurement | Immigrants from West Indies | Tongan |
| Minimum | $26,894 | $5,622 |
| Maximum | $45,008 | $85,704 |
| Range | $18,114 | $80,082 |
| Mean | $37,133 | $37,644 |
| Median | $37,421 | $35,100 |
| Interquartile 25% (IQ1) | $34,659 | $30,397 |
| Interquartile 75% (IQ3) | $40,860 | $42,507 |
| Interquartile Range (IQR) | $6,201 | $12,110 |
| Standard Deviation (Sample) | $5,188 | $12,429 |
| Standard Deviation (Population) | $5,042 | $12,321 |
Demographics Similar to Immigrants from West Indies and Tongans by Per Capita Income
In terms of per capita income, the demographic groups most similar to Immigrants from West Indies are Delaware ($40,778, a difference of 0.040%), Immigrants from Guyana ($40,742, a difference of 0.050%), Guyanese ($40,949, a difference of 0.46%), Senegalese ($41,000, a difference of 0.58%), and Native Hawaiian ($41,017, a difference of 0.62%). Similarly, the demographic groups most similar to Tongans are Sudanese ($41,695, a difference of 0.010%), Guamanian/Chamorro ($41,678, a difference of 0.030%), Trinidadian and Tobagonian ($41,655, a difference of 0.090%), Puget Sound Salish ($41,495, a difference of 0.48%), and Immigrants from Barbados ($41,478, a difference of 0.52%).
| Demographics | Rating | Rank | Per Capita Income |
| Sudanese | 9.9 /100 | #215 | Tragic $41,695 |
| Tongans | 9.9 /100 | #216 | Tragic $41,693 |
| Guamanians/Chamorros | 9.7 /100 | #217 | Tragic $41,678 |
| Trinidadians and Tobagonians | 9.5 /100 | #218 | Tragic $41,655 |
| Puget Sound Salish | 8.1 /100 | #219 | Tragic $41,495 |
| Immigrants | Barbados | 7.9 /100 | #220 | Tragic $41,478 |
| Immigrants | Trinidad and Tobago | 7.9 /100 | #221 | Tragic $41,476 |
| Immigrants | Iraq | 7.1 /100 | #222 | Tragic $41,365 |
| Immigrants | Cameroon | 6.8 /100 | #223 | Tragic $41,334 |
| Immigrants | St. Vincent and the Grenadines | 6.4 /100 | #224 | Tragic $41,270 |
| West Indians | 6.0 /100 | #225 | Tragic $41,217 |
| Immigrants | Ecuador | 5.9 /100 | #226 | Tragic $41,195 |
| Immigrants | Ghana | 5.5 /100 | #227 | Tragic $41,131 |
| Immigrants | Grenada | 5.5 /100 | #228 | Tragic $41,123 |
| Nigerians | 4.9 /100 | #229 | Tragic $41,026 |
| Native Hawaiians | 4.9 /100 | #230 | Tragic $41,017 |
| Senegalese | 4.8 /100 | #231 | Tragic $41,000 |
| Guyanese | 4.5 /100 | #232 | Tragic $40,949 |
| Delaware | 3.8 /100 | #233 | Tragic $40,778 |
| Immigrants | West Indies | 3.7 /100 | #234 | Tragic $40,763 |
| Immigrants | Guyana | 3.6 /100 | #235 | Tragic $40,742 |