Okinawan vs South African Per Capita Income

COMPARE

Okinawan
Race
Ancestry
AfghanAfricanAlaska NativeAlaskan AthabascanAlbanianAleutAlsatianAmericanApacheArabArapahoArgentineanArmenianAssyrian/Chaldean/SyriacAustralianAustrianBahamianBangladeshiBarbadianBasqueBelgianBelizeanBermudanBhutaneseBlackfeetBolivianBrazilianBritishBritish West IndianBulgarianBurmeseCajunCambodianCanadianCape VerdeanCarpatho RusynCelticCentral AmericanCentral American IndianCherokeeCheyenneChickasawChileanChineseChippewaChoctawColombianColvilleComancheCosta RicanCreeCreekCroatianCrowCubanCypriotCzechCzechoslovakianDanishDelawareDominicanDutchDutch West IndianEastern EuropeanEcuadorianEgyptianEnglishEstonianEthiopianEuropeanFijianFilipinoFinnishFrenchFrench American IndianFrench CanadianGermanGerman RussianGhanaianGreekGuamanian/ChamorroGuatemalanGuyaneseHaitianHmongHonduranHopiHoumaHungarianIcelanderIndian (Asian)IndonesianInupiatIranianIraqiIrishIroquoisIsraeliItalianJamaicanJapaneseJordanianKenyanKiowaKoreanLaotianLatvianLebaneseLiberianLithuanianLumbeeLuxembourgerMacedonianMalaysianMalteseMarshalleseMenomineeMexicanMexican American IndianMongolianMoroccanNative HawaiianNavajoNepaleseNew ZealanderNicaraguanNigerianNorthern EuropeanNorwegianOkinawanOsageOttawaPaiutePakistaniPalestinianPanamanianParaguayanPennsylvania GermanPeruvianPimaPolishPortuguesePotawatomiPuebloPuerto RicanPuget Sound SalishRomanianRussianSalvadoranSamoanScandinavianScotch-IrishScottishSeminoleSenegaleseSerbianShoshoneSierra LeoneanSiouxSlavicSlovakSloveneSomaliSouth AmericanSouth American IndianSoviet UnionSpaniardSpanishSpanish AmericanSpanish American IndianSri LankanSubsaharan AfricanSudaneseSwedishSwissSyrianTaiwaneseThaiTlingit-HaidaTohono O'OdhamTonganTrinidadian and TobagonianTsimshianTurkishU.S. Virgin IslanderUgandanUkrainianUruguayanUteVenezuelanVietnameseWelshWest IndianYakamaYaquiYugoslavianYumanYup'ikZimbabwean
Immigration
NonimmigrantsImmigrantsAfghanistanAfricaAlbaniaArgentinaArmeniaAsiaAustraliaAustriaBahamasBangladeshBarbadosBelarusBelgiumBelizeBoliviaBosnia and HerzegovinaBrazilBulgariaBurma/MyanmarCabo VerdeCambodiaCameroonCanadaCaribbeanCentral AmericaChileChinaColombiaCongoCosta RicaCroatiaCubaCzechoslovakiaDenmarkDominicaDominican RepublicEastern AfricaEastern AsiaEastern EuropeEcuadorEgyptEl SalvadorEnglandEritreaEthiopiaEuropeFijiFranceGermanyGhanaGreeceGrenadaGuatemalaGuyanaHaitiHondurasHong KongHungaryIndiaIndonesiaIranIraqIrelandIsraelItalyJamaicaJapanJordanKazakhstanKenyaKoreaKuwaitLaosLatin AmericaLatviaLebanonLiberiaLithuaniaMalaysiaMexicoMicronesiaMiddle AfricaMoldovaMoroccoNepalNetherlandsNicaraguaNigeriaNorth AmericaNorth MacedoniaNorthern AfricaNorthern EuropeNorwayOceaniaPakistanPanamaPeruPhilippinesPolandPortugalRomaniaRussiaSaudi ArabiaScotlandSenegalSerbiaSierra LeoneSingaporeSomaliaSouth AfricaSouth AmericaSouth Central AsiaSouth Eastern AsiaSouthern EuropeSpainSri LankaSt. Vincent and the GrenadinesSudanSwedenSwitzerlandSyriaTaiwanThailandTrinidad and TobagoTurkeyUgandaUkraineUruguayUzbekistanVenezuelaVietnamWest IndiesWestern AfricaWestern AsiaWestern EuropeYemenZaireZimbabweAzores
South African
Race
Ancestry
AfghanAfricanAlaska NativeAlaskan AthabascanAlbanianAleutAlsatianAmericanApacheArabArapahoArgentineanArmenianAssyrian/Chaldean/SyriacAustralianAustrianBahamianBangladeshiBarbadianBasqueBelgianBelizeanBermudanBhutaneseBlackfeetBolivianBrazilianBritishBritish West IndianBulgarianBurmeseCajunCambodianCanadianCape VerdeanCarpatho RusynCelticCentral AmericanCentral American IndianCherokeeCheyenneChickasawChileanChineseChippewaChoctawColombianColvilleComancheCosta RicanCreeCreekCroatianCrowCubanCypriotCzechCzechoslovakianDanishDelawareDominicanDutchDutch West IndianEastern EuropeanEcuadorianEgyptianEnglishEstonianEthiopianEuropeanFijianFilipinoFinnishFrenchFrench American IndianFrench CanadianGermanGerman RussianGhanaianGreekGuamanian/ChamorroGuatemalanGuyaneseHaitianHmongHonduranHopiHoumaHungarianIcelanderIndian (Asian)IndonesianInupiatIranianIraqiIrishIroquoisIsraeliItalianJamaicanJapaneseJordanianKenyanKiowaKoreanLaotianLatvianLebaneseLiberianLithuanianLumbeeLuxembourgerMacedonianMalaysianMalteseMarshalleseMenomineeMexicanMexican American IndianMongolianMoroccanNative HawaiianNavajoNepaleseNew ZealanderNicaraguanNigerianNorthern EuropeanNorwegianOsageOttawaPaiutePakistaniPalestinianPanamanianParaguayanPennsylvania GermanPeruvianPimaPolishPortuguesePotawatomiPuebloPuerto RicanPuget Sound SalishRomanianRussianSalvadoranSamoanScandinavianScotch-IrishScottishSeminoleSenegaleseSerbianShoshoneSierra LeoneanSiouxSlavicSlovakSloveneSomaliSouth AfricanSouth AmericanSouth American IndianSoviet UnionSpaniardSpanishSpanish AmericanSpanish American IndianSri LankanSubsaharan AfricanSudaneseSwedishSwissSyrianTaiwaneseThaiTlingit-HaidaTohono O'OdhamTonganTrinidadian and TobagonianTsimshianTurkishU.S. Virgin IslanderUgandanUkrainianUruguayanUteVenezuelanVietnameseWelshWest IndianYakamaYaquiYugoslavianYumanYup'ikZimbabwean
Immigration
NonimmigrantsImmigrantsAfghanistanAfricaAlbaniaArgentinaArmeniaAsiaAustraliaAustriaBahamasBangladeshBarbadosBelarusBelgiumBelizeBoliviaBosnia and HerzegovinaBrazilBulgariaBurma/MyanmarCabo VerdeCambodiaCameroonCanadaCaribbeanCentral AmericaChileChinaColombiaCongoCosta RicaCroatiaCubaCzechoslovakiaDenmarkDominicaDominican RepublicEastern AfricaEastern AsiaEastern EuropeEcuadorEgyptEl SalvadorEnglandEritreaEthiopiaEuropeFijiFranceGermanyGhanaGreeceGrenadaGuatemalaGuyanaHaitiHondurasHong KongHungaryIndiaIndonesiaIranIraqIrelandIsraelItalyJamaicaJapanJordanKazakhstanKenyaKoreaKuwaitLaosLatin AmericaLatviaLebanonLiberiaLithuaniaMalaysiaMexicoMicronesiaMiddle AfricaMoldovaMoroccoNepalNetherlandsNicaraguaNigeriaNorth AmericaNorth MacedoniaNorthern AfricaNorthern EuropeNorwayOceaniaPakistanPanamaPeruPhilippinesPolandPortugalRomaniaRussiaSaudi ArabiaScotlandSenegalSerbiaSierra LeoneSingaporeSomaliaSouth AfricaSouth AmericaSouth Central AsiaSouth Eastern AsiaSouthern EuropeSpainSri LankaSt. Vincent and the GrenadinesSudanSwedenSwitzerlandSyriaTaiwanThailandTrinidad and TobagoTurkeyUgandaUkraineUruguayUzbekistanVenezuelaVietnamWest IndiesWestern AfricaWestern AsiaWestern EuropeYemenZaireZimbabweAzores
Per Capita Income
Income
Poverty
Unemployment
Labor Participation
Family Structure
Vehicle Availability
Education Level
Disability

Per Capita Income Comparison

Okinawans

South Africans

Exceptional
Exceptional
$55,817
PER CAPITA INCOME
100.0/ 100
METRIC RATING
10th/ 347
METRIC RANK
$50,044
PER CAPITA INCOME
99.9/ 100
METRIC RATING
57th/ 347
METRIC RANK

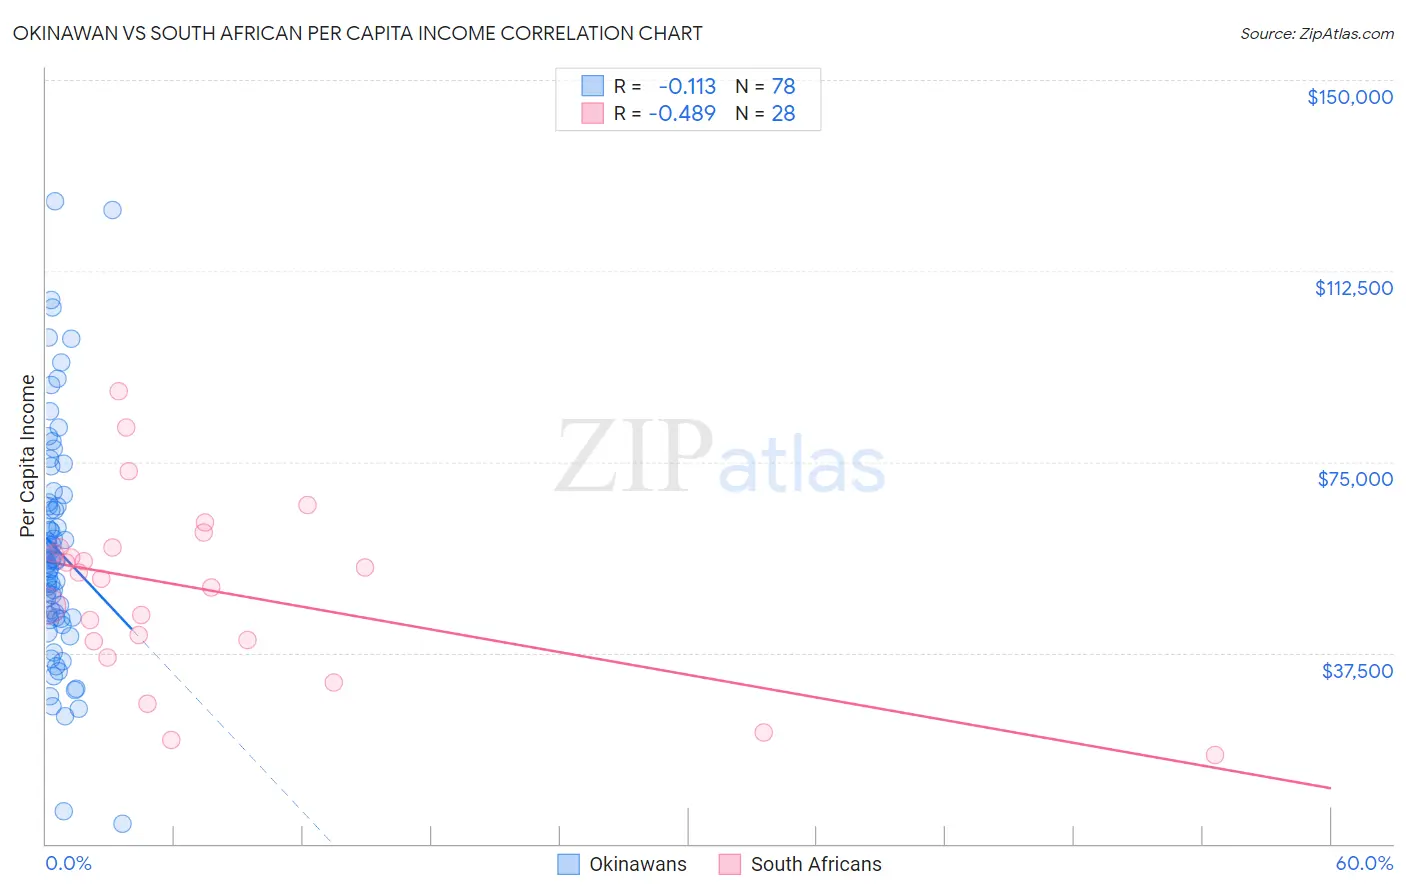
Okinawan vs South African Per Capita Income Correlation Chart

The statistical analysis conducted on geographies consisting of 73,745,153 people shows a poor negative correlation between the proportion of Okinawans and per capita income in the United States with a correlation coefficient (R) of -0.113 and weighted average of $55,817. Similarly, the statistical analysis conducted on geographies consisting of 182,604,546 people shows a moderate negative correlation between the proportion of South Africans and per capita income in the United States with a correlation coefficient (R) of -0.489 and weighted average of $50,044, a difference of 11.5%.
Okinawan vs South African Per Capita Income

Per Capita Income Correlation Summary

MeasurementOkinawanSouth African
Minimum$4,017$17,364
Maximum$126,204$88,818
Range$122,187$71,454
Mean$57,948$49,855
Median$55,509$52,728
Interquartile 25% (IQ1)$44,396$39,824
Interquartile 75% (IQ3)$66,910$58,137
Interquartile Range (IQR)$22,513$18,313
Standard Deviation (Sample)$23,213$17,281
Standard Deviation (Population)$23,064$16,970

Similar Demographics by Per Capita Income

Demographics Similar to Okinawans by Per Capita Income

In terms of per capita income, the demographic groups most similar to Okinawans are Eastern European ($55,780, a difference of 0.070%), Immigrants from Sweden ($55,582, a difference of 0.42%), Immigrants from India ($55,268, a difference of 0.99%), Immigrants from Belgium ($55,082, a difference of 1.3%), and Immigrants from Ireland ($56,584, a difference of 1.4%).
DemographicsRating | RankPer Capita Income
Immigrants | Singapore
100.0
/100
|
#3
Exceptional
$58,353
Immigrants | Australia
100.0
/100
|
#4
Exceptional
$57,953
Immigrants | Iran
100.0
/100
|
#5
Exceptional
$57,759
Immigrants | Taiwan
100.0
/100
|
#6
Exceptional
$57,742
Immigrants | Israel
100.0
/100
|
#7
Exceptional
$57,384
Immigrants | Hong Kong
100.0
/100
|
#8
Exceptional
$56,709
Immigrants | Ireland
100.0
/100
|
#9
Exceptional
$56,584
Okinawans
100.0
/100
|
#10
Exceptional
$55,817
Eastern Europeans
100.0
/100
|
#11
Exceptional
$55,780
Immigrants | Sweden
100.0
/100
|
#12
Exceptional
$55,582
Immigrants | India
100.0
/100
|
#13
Exceptional
$55,268
Immigrants | Belgium
100.0
/100
|
#14
Exceptional
$55,082
Cypriots
100.0
/100
|
#15
Exceptional
$54,899
Immigrants | Switzerland
100.0
/100
|
#16
Exceptional
$54,866
Immigrants | France
100.0
/100
|
#17
Exceptional
$54,557

Demographics Similar to South Africans by Per Capita Income

In terms of per capita income, the demographic groups most similar to South Africans are Asian ($50,057, a difference of 0.030%), Immigrants from Western Europe ($50,065, a difference of 0.040%), Immigrants from Malaysia ($49,983, a difference of 0.12%), Bhutanese ($49,894, a difference of 0.30%), and Immigrants from Scotland ($49,893, a difference of 0.30%).
DemographicsRating | RankPer Capita Income
Immigrants | Sri Lanka
100.0
/100
|
#50
Exceptional
$50,555
Immigrants | Netherlands
100.0
/100
|
#51
Exceptional
$50,458
Immigrants | Croatia
99.9
/100
|
#52
Exceptional
$50,417
Paraguayans
99.9
/100
|
#53
Exceptional
$50,385
Immigrants | Belarus
99.9
/100
|
#54
Exceptional
$50,303
Immigrants | Western Europe
99.9
/100
|
#55
Exceptional
$50,065
Asians
99.9
/100
|
#56
Exceptional
$50,057
South Africans
99.9
/100
|
#57
Exceptional
$50,044
Immigrants | Malaysia
99.9
/100
|
#58
Exceptional
$49,983
Bhutanese
99.9
/100
|
#59
Exceptional
$49,894
Immigrants | Scotland
99.9
/100
|
#60
Exceptional
$49,893
Argentineans
99.9
/100
|
#61
Exceptional
$49,862
Immigrants | Asia
99.9
/100
|
#62
Exceptional
$49,741
Maltese
99.9
/100
|
#63
Exceptional
$49,640
Immigrants | Argentina
99.9
/100
|
#64
Exceptional
$49,627