Armenian vs Immigrants from Uzbekistan Per Capita Income
COMPARE
Armenian
Immigrants from Uzbekistan
Per Capita Income
Per Capita Income Comparison
Armenians
Immigrants from Uzbekistan
$48,287
PER CAPITA INCOME
99.4/ 100
METRIC RATING
81st/ 347
METRIC RANK
$46,929
PER CAPITA INCOME
97.5/ 100
METRIC RATING
101st/ 347
METRIC RANK
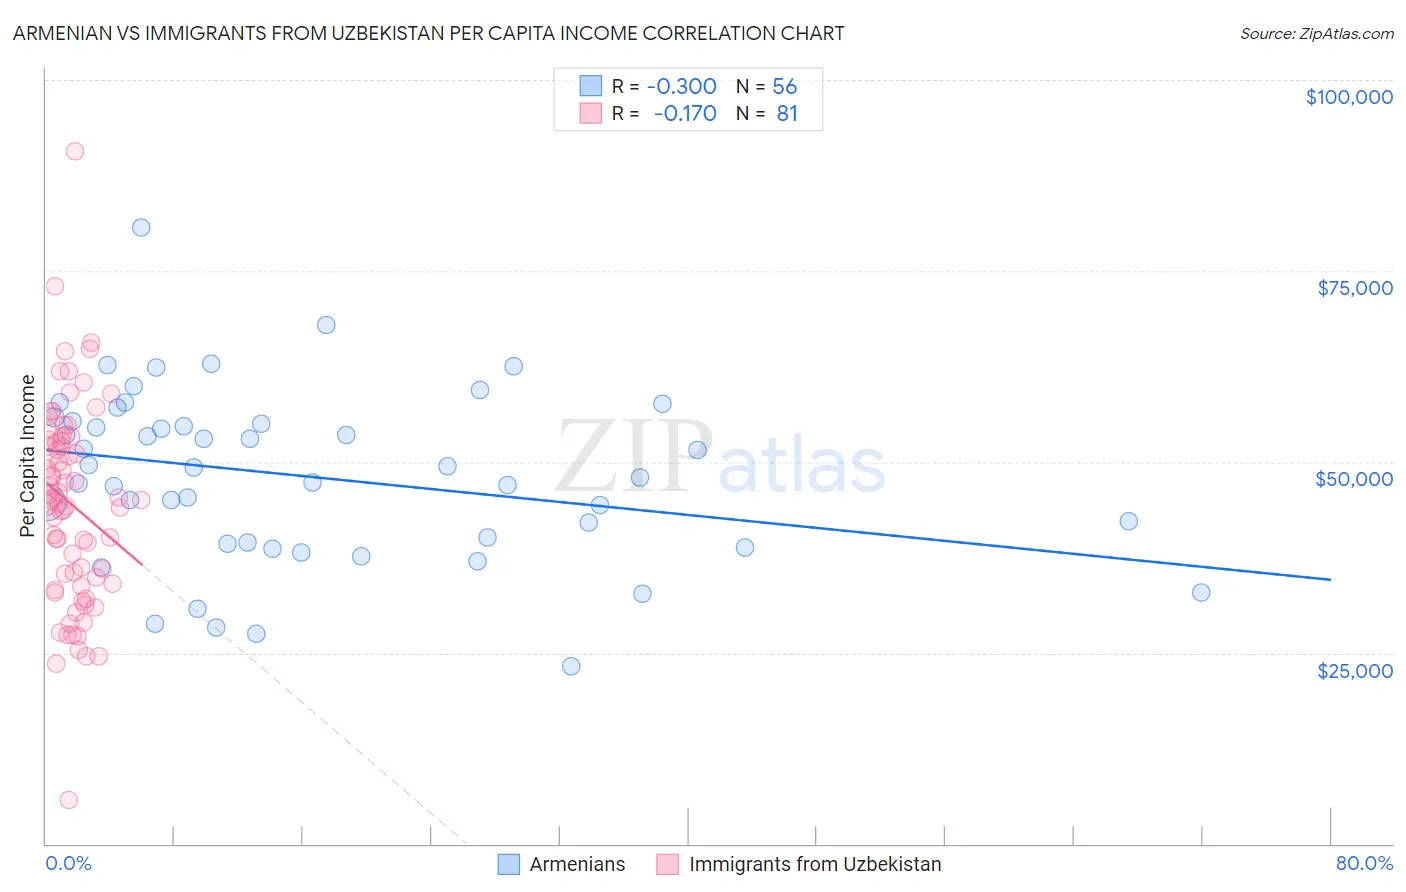
Armenian vs Immigrants from Uzbekistan Per Capita Income Correlation Chart
The statistical analysis conducted on geographies consisting of 310,965,464 people shows a mild negative correlation between the proportion of Armenians and per capita income in the United States with a correlation coefficient (R) of -0.300 and weighted average of $48,287. Similarly, the statistical analysis conducted on geographies consisting of 118,766,454 people shows a poor negative correlation between the proportion of Immigrants from Uzbekistan and per capita income in the United States with a correlation coefficient (R) of -0.170 and weighted average of $46,929, a difference of 2.9%.
Per Capita Income Correlation Summary
| Measurement | Armenian | Immigrants from Uzbekistan |
| Minimum | $23,281 | $5,747 |
| Maximum | $80,691 | $90,679 |
| Range | $57,410 | $84,932 |
| Mean | $48,045 | $44,513 |
| Median | $48,616 | $45,080 |
| Interquartile 25% (IQ1) | $39,345 | $34,402 |
| Interquartile 75% (IQ3) | $55,100 | $52,838 |
| Interquartile Range (IQR) | $15,755 | $18,436 |
| Standard Deviation (Sample) | $11,238 | $13,145 |
| Standard Deviation (Population) | $11,138 | $13,064 |
Demographics Similar to Armenians and Immigrants from Uzbekistan by Per Capita Income
In terms of per capita income, the demographic groups most similar to Armenians are Immigrants from Indonesia ($48,195, a difference of 0.19%), Immigrants from Brazil ($48,164, a difference of 0.26%), Immigrants from Ukraine ($48,134, a difference of 0.32%), Austrian ($48,116, a difference of 0.36%), and Immigrants from Southern Europe ($48,027, a difference of 0.54%). Similarly, the demographic groups most similar to Immigrants from Uzbekistan are Immigrants from Lebanon ($46,938, a difference of 0.020%), Laotian ($47,041, a difference of 0.24%), Immigrants from Pakistan ($47,084, a difference of 0.33%), Carpatho Rusyn ($47,248, a difference of 0.68%), and Alsatian ($47,284, a difference of 0.76%).
| Demographics | Rating | Rank | Per Capita Income |
| Armenians | 99.4 /100 | #81 | Exceptional $48,287 |
| Immigrants | Indonesia | 99.4 /100 | #82 | Exceptional $48,195 |
| Immigrants | Brazil | 99.4 /100 | #83 | Exceptional $48,164 |
| Immigrants | Ukraine | 99.3 /100 | #84 | Exceptional $48,134 |
| Austrians | 99.3 /100 | #85 | Exceptional $48,116 |
| Immigrants | Southern Europe | 99.3 /100 | #86 | Exceptional $48,027 |
| Ukrainians | 99.3 /100 | #87 | Exceptional $48,014 |
| Croatians | 99.0 /100 | #88 | Exceptional $47,742 |
| Northern Europeans | 98.9 /100 | #89 | Exceptional $47,698 |
| Italians | 98.8 /100 | #90 | Exceptional $47,574 |
| Macedonians | 98.8 /100 | #91 | Exceptional $47,573 |
| Immigrants | Moldova | 98.7 /100 | #92 | Exceptional $47,489 |
| Immigrants | Zimbabwe | 98.5 /100 | #93 | Exceptional $47,394 |
| Albanians | 98.5 /100 | #94 | Exceptional $47,379 |
| Immigrants | Egypt | 98.5 /100 | #95 | Exceptional $47,361 |
| Alsatians | 98.3 /100 | #96 | Exceptional $47,284 |
| Carpatho Rusyns | 98.2 /100 | #97 | Exceptional $47,248 |
| Immigrants | Pakistan | 97.9 /100 | #98 | Exceptional $47,084 |
| Laotians | 97.8 /100 | #99 | Exceptional $47,041 |
| Immigrants | Lebanon | 97.5 /100 | #100 | Exceptional $46,938 |
| Immigrants | Uzbekistan | 97.5 /100 | #101 | Exceptional $46,929 |