Arab vs Immigrants from Bahamas Per Capita Income
COMPARE
Arab
Immigrants from Bahamas
Per Capita Income
Per Capita Income Comparison
Arabs
Immigrants from Bahamas
$45,662
PER CAPITA INCOME
90.4/ 100
METRIC RATING
130th/ 347
METRIC RANK
$37,193
PER CAPITA INCOME
0.1/ 100
METRIC RATING
300th/ 347
METRIC RANK
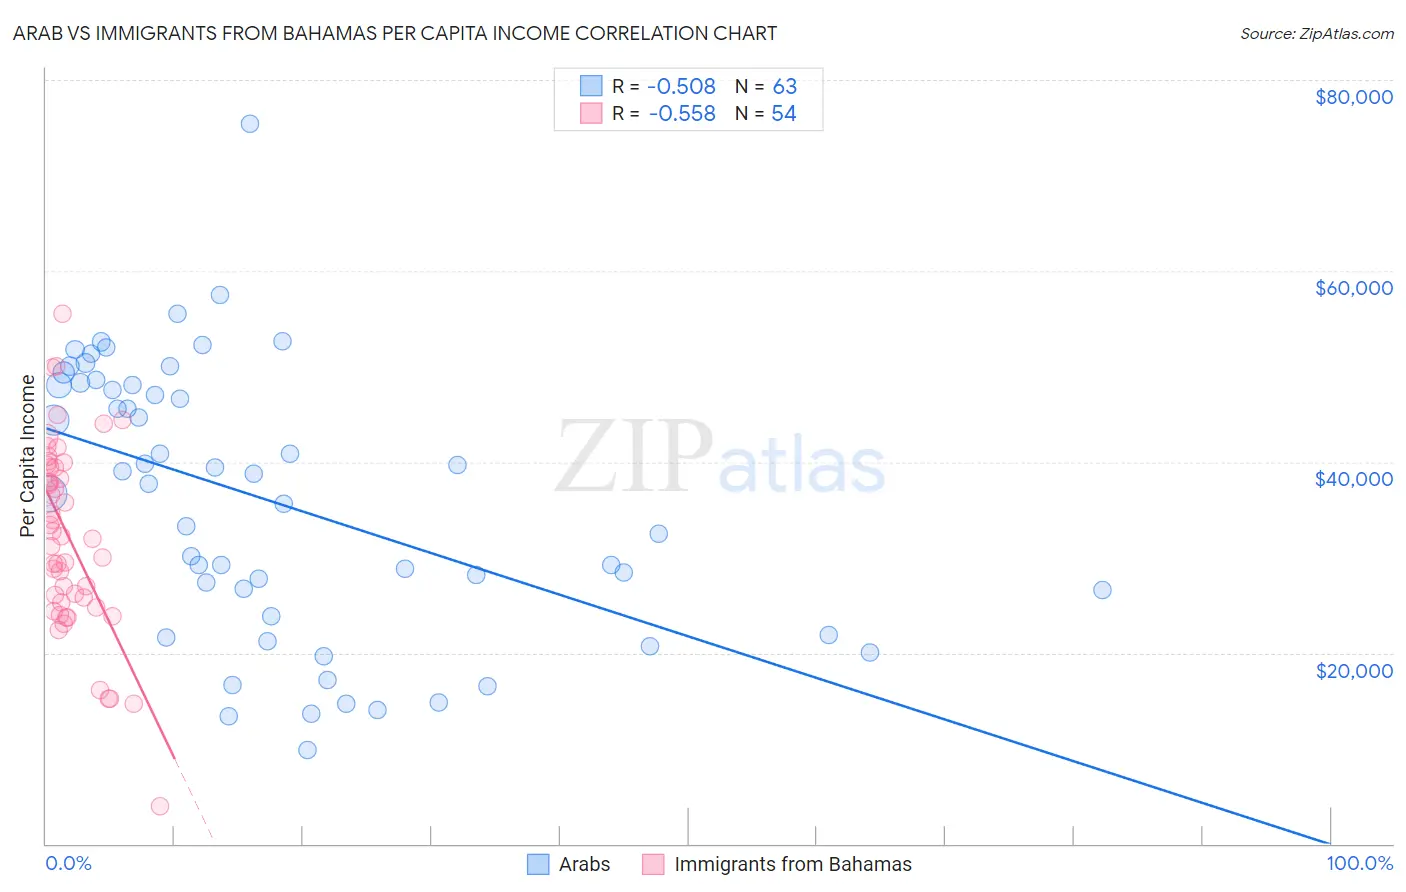
Arab vs Immigrants from Bahamas Per Capita Income Correlation Chart
The statistical analysis conducted on geographies consisting of 486,915,485 people shows a substantial negative correlation between the proportion of Arabs and per capita income in the United States with a correlation coefficient (R) of -0.508 and weighted average of $45,662. Similarly, the statistical analysis conducted on geographies consisting of 104,665,550 people shows a substantial negative correlation between the proportion of Immigrants from Bahamas and per capita income in the United States with a correlation coefficient (R) of -0.558 and weighted average of $37,193, a difference of 22.8%.
Per Capita Income Correlation Summary
| Measurement | Arab | Immigrants from Bahamas |
| Minimum | $9,805 | $3,864 |
| Maximum | $75,372 | $55,468 |
| Range | $65,567 | $51,604 |
| Mean | $35,873 | $32,077 |
| Median | $37,723 | $32,055 |
| Interquartile 25% (IQ1) | $23,895 | $25,247 |
| Interquartile 75% (IQ3) | $48,040 | $39,474 |
| Interquartile Range (IQR) | $24,145 | $14,227 |
| Standard Deviation (Sample) | $14,217 | $9,963 |
| Standard Deviation (Population) | $14,103 | $9,870 |
Similar Demographics by Per Capita Income
Demographics Similar to Arabs by Per Capita Income
In terms of per capita income, the demographic groups most similar to Arabs are Luxembourger ($45,663, a difference of 0.0%), Immigrants from North Macedonia ($45,622, a difference of 0.090%), Jordanian ($45,605, a difference of 0.12%), Pakistani ($45,587, a difference of 0.16%), and Slovene ($45,581, a difference of 0.18%).
| Demographics | Rating | Rank | Per Capita Income |
| Lebanese | 92.0 /100 | #123 | Exceptional $45,840 |
| Europeans | 92.0 /100 | #124 | Exceptional $45,836 |
| Zimbabweans | 91.7 /100 | #125 | Exceptional $45,804 |
| Palestinians | 91.6 /100 | #126 | Exceptional $45,790 |
| Immigrants | Germany | 91.3 /100 | #127 | Exceptional $45,751 |
| Swedes | 91.3 /100 | #128 | Exceptional $45,750 |
| Luxembourgers | 90.4 /100 | #129 | Exceptional $45,663 |
| Arabs | 90.4 /100 | #130 | Exceptional $45,662 |
| Immigrants | North Macedonia | 90.0 /100 | #131 | Exceptional $45,622 |
| Jordanians | 89.9 /100 | #132 | Excellent $45,605 |
| Pakistanis | 89.7 /100 | #133 | Excellent $45,587 |
| Slovenes | 89.6 /100 | #134 | Excellent $45,581 |
| Hungarians | 87.9 /100 | #135 | Excellent $45,426 |
| Immigrants | Oceania | 85.2 /100 | #136 | Excellent $45,220 |
| Immigrants | Syria | 85.2 /100 | #137 | Excellent $45,218 |
Demographics Similar to Immigrants from Bahamas by Per Capita Income
In terms of per capita income, the demographic groups most similar to Immigrants from Bahamas are Cherokee ($37,203, a difference of 0.030%), Immigrants from Caribbean ($37,254, a difference of 0.17%), Ottawa ($37,101, a difference of 0.25%), Haitian ($37,289, a difference of 0.26%), and Indonesian ($37,300, a difference of 0.29%).
| Demographics | Rating | Rank | Per Capita Income |
| Mexican American Indians | 0.1 /100 | #293 | Tragic $37,407 |
| Cubans | 0.1 /100 | #294 | Tragic $37,383 |
| Immigrants | Dominican Republic | 0.1 /100 | #295 | Tragic $37,306 |
| Indonesians | 0.1 /100 | #296 | Tragic $37,300 |
| Haitians | 0.1 /100 | #297 | Tragic $37,289 |
| Immigrants | Caribbean | 0.1 /100 | #298 | Tragic $37,254 |
| Cherokee | 0.1 /100 | #299 | Tragic $37,203 |
| Immigrants | Bahamas | 0.1 /100 | #300 | Tragic $37,193 |
| Ottawa | 0.1 /100 | #301 | Tragic $37,101 |
| Shoshone | 0.1 /100 | #302 | Tragic $37,072 |
| Paiute | 0.1 /100 | #303 | Tragic $37,066 |
| Hondurans | 0.1 /100 | #304 | Tragic $37,031 |
| Inupiat | 0.1 /100 | #305 | Tragic $36,999 |
| Immigrants | Haiti | 0.0 /100 | #306 | Tragic $36,849 |
| Immigrants | Latin America | 0.0 /100 | #307 | Tragic $36,823 |