Cree vs Immigrants from Austria Median Male Earnings
COMPARE
Cree
Immigrants from Austria
Median Male Earnings
Median Male Earnings Comparison
Cree
Immigrants from Austria
$49,497
MEDIAN MALE EARNINGS
0.7/ 100
METRIC RATING
258th/ 347
METRIC RANK
$62,164
MEDIAN MALE EARNINGS
99.9/ 100
METRIC RATING
47th/ 347
METRIC RANK
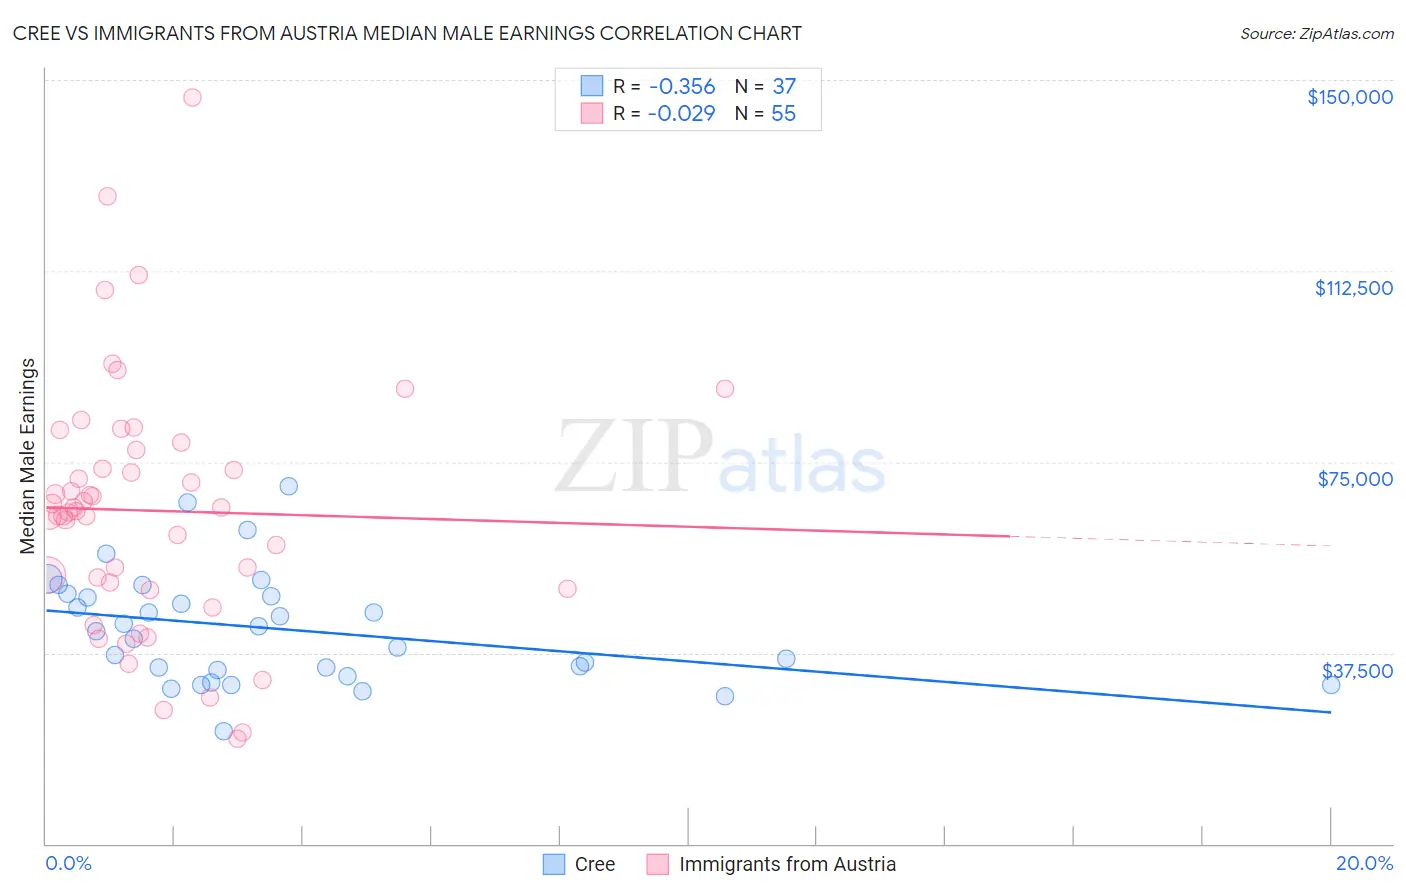
Cree vs Immigrants from Austria Median Male Earnings Correlation Chart
The statistical analysis conducted on geographies consisting of 76,198,776 people shows a mild negative correlation between the proportion of Cree and median male earnings in the United States with a correlation coefficient (R) of -0.356 and weighted average of $49,497. Similarly, the statistical analysis conducted on geographies consisting of 167,941,701 people shows no correlation between the proportion of Immigrants from Austria and median male earnings in the United States with a correlation coefficient (R) of -0.029 and weighted average of $62,164, a difference of 25.6%.
Median Male Earnings Correlation Summary
| Measurement | Cree | Immigrants from Austria |
| Minimum | $22,163 | $20,568 |
| Maximum | $70,294 | $146,444 |
| Range | $48,131 | $125,876 |
| Mean | $42,158 | $65,411 |
| Median | $41,730 | $65,258 |
| Interquartile 25% (IQ1) | $33,580 | $50,000 |
| Interquartile 75% (IQ3) | $48,892 | $77,315 |
| Interquartile Range (IQR) | $15,312 | $27,315 |
| Standard Deviation (Sample) | $10,951 | $24,493 |
| Standard Deviation (Population) | $10,802 | $24,269 |
Similar Demographics by Median Male Earnings
Demographics Similar to Cree by Median Male Earnings
In terms of median male earnings, the demographic groups most similar to Cree are Nepalese ($49,458, a difference of 0.080%), Iroquois ($49,374, a difference of 0.25%), British West Indian ($49,636, a difference of 0.28%), Liberian ($49,318, a difference of 0.36%), and Alaska Native ($49,711, a difference of 0.43%).
| Demographics | Rating | Rank | Median Male Earnings |
| Immigrants | Grenada | 1.6 /100 | #251 | Tragic $50,279 |
| Immigrants | Cabo Verde | 1.2 /100 | #252 | Tragic $50,009 |
| German Russians | 1.1 /100 | #253 | Tragic $49,924 |
| Senegalese | 1.0 /100 | #254 | Tragic $49,774 |
| Alaskan Athabascans | 0.9 /100 | #255 | Tragic $49,748 |
| Alaska Natives | 0.9 /100 | #256 | Tragic $49,711 |
| British West Indians | 0.8 /100 | #257 | Tragic $49,636 |
| Cree | 0.7 /100 | #258 | Tragic $49,497 |
| Nepalese | 0.7 /100 | #259 | Tragic $49,458 |
| Iroquois | 0.7 /100 | #260 | Tragic $49,374 |
| Liberians | 0.6 /100 | #261 | Tragic $49,318 |
| Immigrants | West Indies | 0.6 /100 | #262 | Tragic $49,271 |
| Nicaraguans | 0.6 /100 | #263 | Tragic $49,215 |
| Immigrants | Middle Africa | 0.6 /100 | #264 | Tragic $49,201 |
| Immigrants | Laos | 0.6 /100 | #265 | Tragic $49,190 |
Demographics Similar to Immigrants from Austria by Median Male Earnings
In terms of median male earnings, the demographic groups most similar to Immigrants from Austria are Immigrants from Malaysia ($62,121, a difference of 0.070%), Immigrants from Czechoslovakia ($62,217, a difference of 0.090%), Immigrants from Europe ($62,057, a difference of 0.17%), Bulgarian ($62,378, a difference of 0.35%), and Cambodian ($62,516, a difference of 0.57%).
| Demographics | Rating | Rank | Median Male Earnings |
| Australians | 100.0 /100 | #40 | Exceptional $62,857 |
| Immigrants | Turkey | 100.0 /100 | #41 | Exceptional $62,728 |
| Immigrants | Greece | 100.0 /100 | #42 | Exceptional $62,689 |
| Immigrants | Belarus | 100.0 /100 | #43 | Exceptional $62,658 |
| Cambodians | 100.0 /100 | #44 | Exceptional $62,516 |
| Bulgarians | 100.0 /100 | #45 | Exceptional $62,378 |
| Immigrants | Czechoslovakia | 99.9 /100 | #46 | Exceptional $62,217 |
| Immigrants | Austria | 99.9 /100 | #47 | Exceptional $62,164 |
| Immigrants | Malaysia | 99.9 /100 | #48 | Exceptional $62,121 |
| Immigrants | Europe | 99.9 /100 | #49 | Exceptional $62,057 |
| Bhutanese | 99.9 /100 | #50 | Exceptional $61,759 |
| Estonians | 99.9 /100 | #51 | Exceptional $61,710 |
| Immigrants | Norway | 99.9 /100 | #52 | Exceptional $61,628 |
| South Africans | 99.9 /100 | #53 | Exceptional $61,460 |
| Immigrants | Latvia | 99.9 /100 | #54 | Exceptional $61,422 |