Haitian vs Immigrants from Honduras Median Male Earnings
COMPARE
Haitian
Immigrants from Honduras
Median Male Earnings
Median Male Earnings Comparison
Haitians
Immigrants from Honduras
$45,903
MEDIAN MALE EARNINGS
0.0/ 100
METRIC RATING
319th/ 347
METRIC RANK
$45,787
MEDIAN MALE EARNINGS
0.0/ 100
METRIC RATING
320th/ 347
METRIC RANK
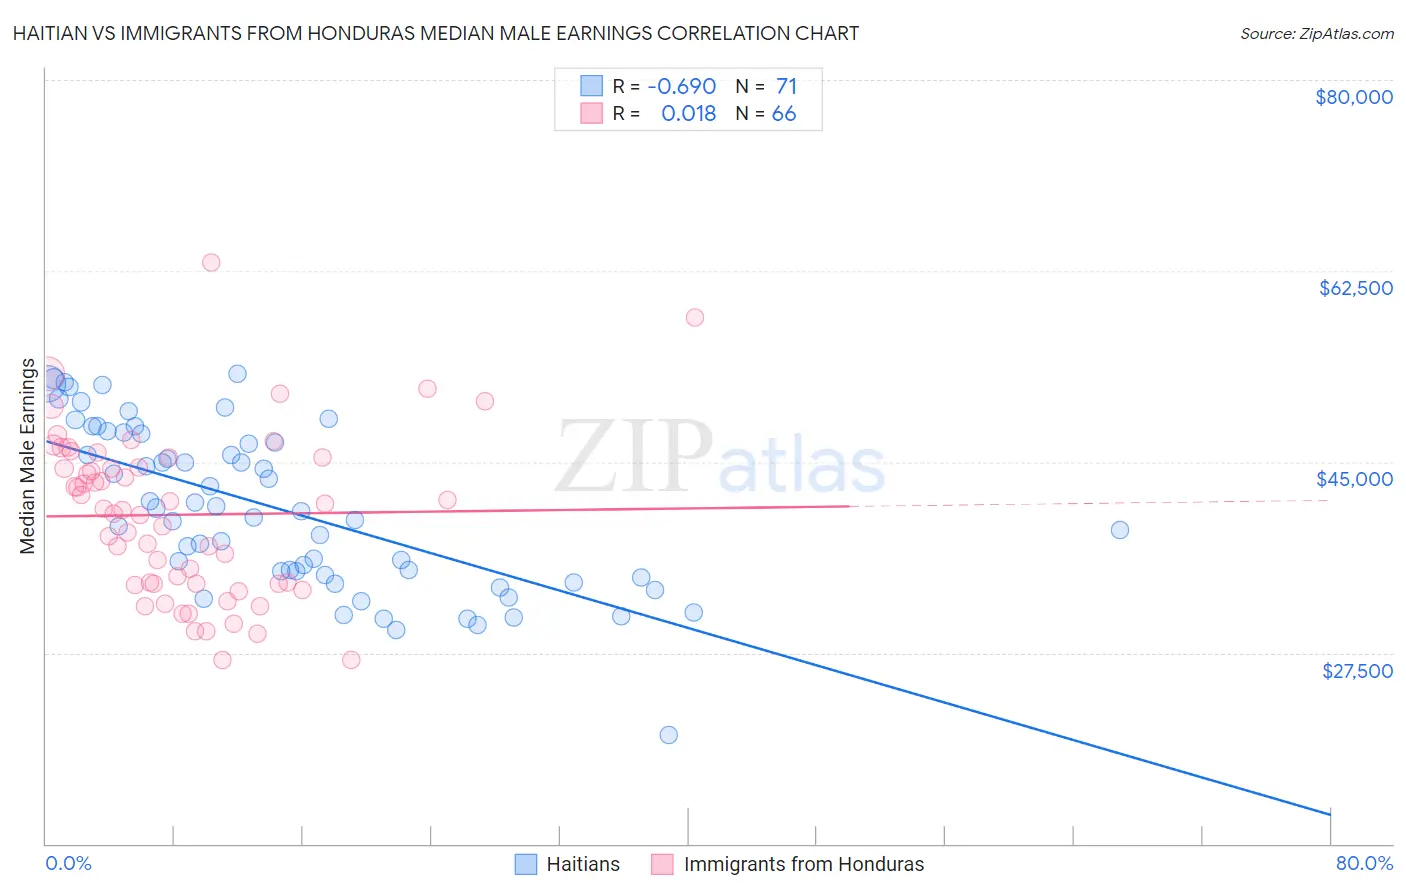
Haitian vs Immigrants from Honduras Median Male Earnings Correlation Chart
The statistical analysis conducted on geographies consisting of 287,952,359 people shows a significant negative correlation between the proportion of Haitians and median male earnings in the United States with a correlation coefficient (R) of -0.690 and weighted average of $45,903. Similarly, the statistical analysis conducted on geographies consisting of 322,554,949 people shows no correlation between the proportion of Immigrants from Honduras and median male earnings in the United States with a correlation coefficient (R) of 0.018 and weighted average of $45,787, a difference of 0.25%.
Median Male Earnings Correlation Summary
| Measurement | Haitian | Immigrants from Honduras |
| Minimum | $19,963 | $26,786 |
| Maximum | $53,128 | $63,286 |
| Range | $33,165 | $36,500 |
| Mean | $40,657 | $40,153 |
| Median | $40,467 | $40,629 |
| Interquartile 25% (IQ1) | $34,672 | $33,830 |
| Interquartile 75% (IQ3) | $47,602 | $45,376 |
| Interquartile Range (IQR) | $12,930 | $11,546 |
| Standard Deviation (Sample) | $7,455 | $7,556 |
| Standard Deviation (Population) | $7,403 | $7,498 |
Demographics Similar to Haitians and Immigrants from Honduras by Median Male Earnings
In terms of median male earnings, the demographic groups most similar to Haitians are Cheyenne ($46,062, a difference of 0.35%), Mexican ($46,147, a difference of 0.53%), Immigrants from Caribbean ($46,193, a difference of 0.63%), Fijian ($45,607, a difference of 0.65%), and Immigrants from Guatemala ($46,244, a difference of 0.74%). Similarly, the demographic groups most similar to Immigrants from Honduras are Fijian ($45,607, a difference of 0.39%), Sioux ($45,566, a difference of 0.48%), Immigrants from Central America ($45,538, a difference of 0.55%), Black/African American ($45,523, a difference of 0.58%), and Cheyenne ($46,062, a difference of 0.60%).
| Demographics | Rating | Rank | Median Male Earnings |
| Creek | 0.0 /100 | #309 | Tragic $46,594 |
| Cubans | 0.0 /100 | #310 | Tragic $46,580 |
| Apache | 0.0 /100 | #311 | Tragic $46,429 |
| Hispanics or Latinos | 0.0 /100 | #312 | Tragic $46,419 |
| Hondurans | 0.0 /100 | #313 | Tragic $46,374 |
| Chippewa | 0.0 /100 | #314 | Tragic $46,368 |
| Immigrants | Guatemala | 0.0 /100 | #315 | Tragic $46,244 |
| Immigrants | Caribbean | 0.0 /100 | #316 | Tragic $46,193 |
| Mexicans | 0.0 /100 | #317 | Tragic $46,147 |
| Cheyenne | 0.0 /100 | #318 | Tragic $46,062 |
| Haitians | 0.0 /100 | #319 | Tragic $45,903 |
| Immigrants | Honduras | 0.0 /100 | #320 | Tragic $45,787 |
| Fijians | 0.0 /100 | #321 | Tragic $45,607 |
| Sioux | 0.0 /100 | #322 | Tragic $45,566 |
| Immigrants | Central America | 0.0 /100 | #323 | Tragic $45,538 |
| Blacks/African Americans | 0.0 /100 | #324 | Tragic $45,523 |
| Yuman | 0.0 /100 | #325 | Tragic $45,446 |
| Immigrants | Haiti | 0.0 /100 | #326 | Tragic $45,266 |
| Immigrants | Bahamas | 0.0 /100 | #327 | Tragic $45,176 |
| Kiowa | 0.0 /100 | #328 | Tragic $45,094 |
| Yakama | 0.0 /100 | #329 | Tragic $45,002 |