Croatian vs Immigrants from Cuba Associate's Degree
COMPARE
Croatian
Immigrants from Cuba
Associate's Degree
Associate's Degree Comparison
Croatians
Immigrants from Cuba
49.3%
ASSOCIATE'S DEGREE
96.8/ 100
METRIC RATING
105th/ 347
METRIC RANK
39.5%
ASSOCIATE'S DEGREE
0.0/ 100
METRIC RATING
288th/ 347
METRIC RANK
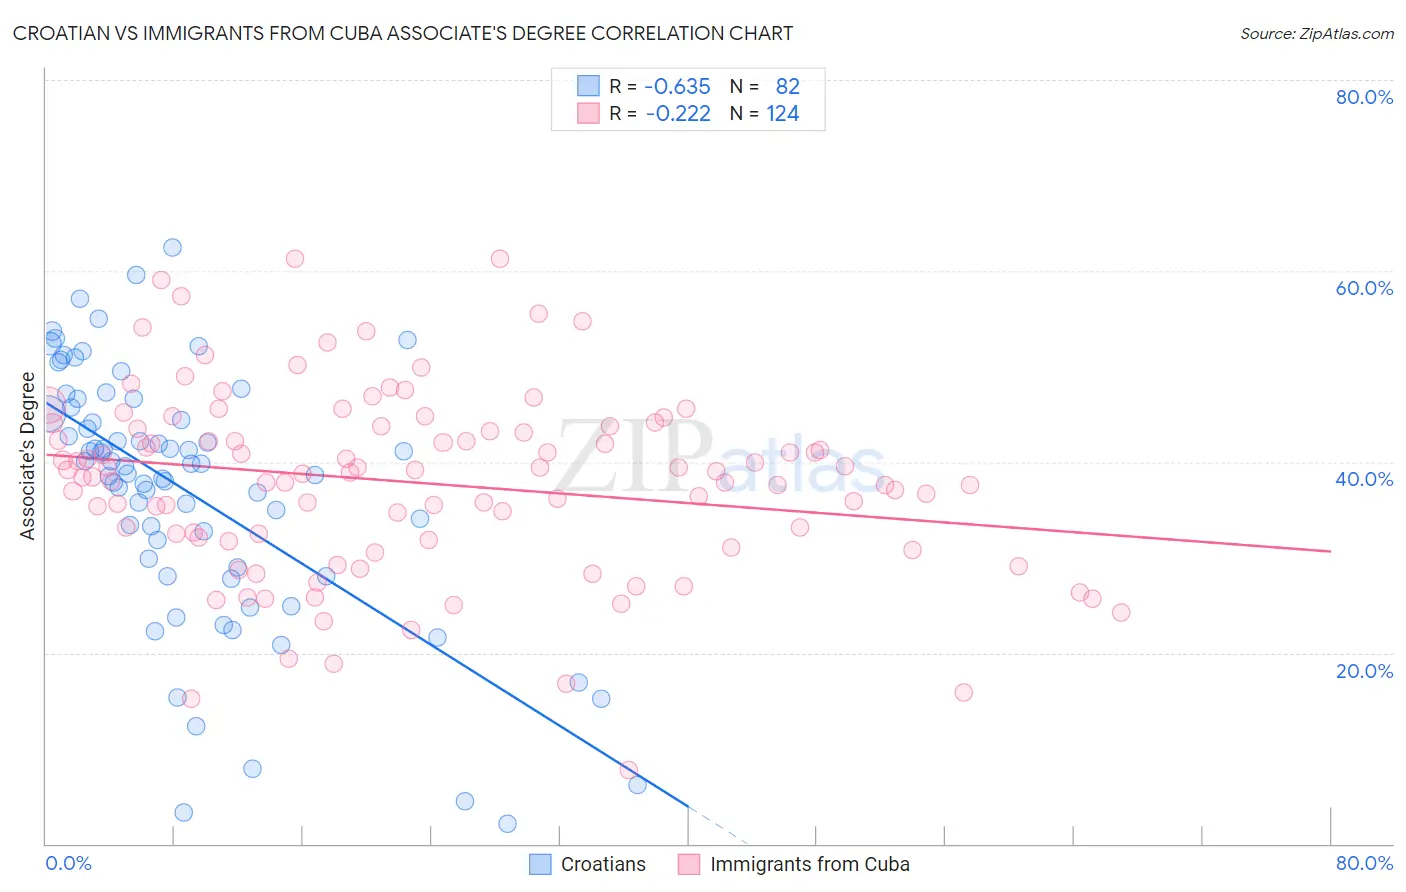
Croatian vs Immigrants from Cuba Associate's Degree Correlation Chart
The statistical analysis conducted on geographies consisting of 375,715,670 people shows a significant negative correlation between the proportion of Croatians and percentage of population with at least associate's degree education in the United States with a correlation coefficient (R) of -0.635 and weighted average of 49.3%. Similarly, the statistical analysis conducted on geographies consisting of 325,963,552 people shows a weak negative correlation between the proportion of Immigrants from Cuba and percentage of population with at least associate's degree education in the United States with a correlation coefficient (R) of -0.222 and weighted average of 39.5%, a difference of 24.7%.
Associate's Degree Correlation Summary
| Measurement | Croatian | Immigrants from Cuba |
| Minimum | 2.1% | 7.8% |
| Maximum | 62.5% | 61.3% |
| Range | 60.4% | 53.5% |
| Mean | 36.8% | 37.8% |
| Median | 39.7% | 38.8% |
| Interquartile 25% (IQ1) | 29.0% | 31.9% |
| Interquartile 75% (IQ3) | 45.8% | 43.6% |
| Interquartile Range (IQR) | 16.8% | 11.7% |
| Standard Deviation (Sample) | 13.4% | 9.7% |
| Standard Deviation (Population) | 13.4% | 9.6% |
Similar Demographics by Associate's Degree
Demographics Similar to Croatians by Associate's Degree
In terms of associate's degree, the demographic groups most similar to Croatians are Immigrants from Italy (49.3%, a difference of 0.0%), Syrian (49.3%, a difference of 0.030%), Jordanian (49.2%, a difference of 0.10%), Venezuelan (49.4%, a difference of 0.15%), and Ukrainian (49.4%, a difference of 0.21%).
| Demographics | Rating | Rank | Associate's Degree |
| Immigrants | Northern Africa | 97.9 /100 | #98 | Exceptional 49.7% |
| Macedonians | 97.8 /100 | #99 | Exceptional 49.6% |
| Immigrants | Nepal | 97.5 /100 | #100 | Exceptional 49.5% |
| Northern Europeans | 97.3 /100 | #101 | Exceptional 49.5% |
| Chileans | 97.3 /100 | #102 | Exceptional 49.4% |
| Ukrainians | 97.1 /100 | #103 | Exceptional 49.4% |
| Venezuelans | 97.0 /100 | #104 | Exceptional 49.4% |
| Croatians | 96.8 /100 | #105 | Exceptional 49.3% |
| Immigrants | Italy | 96.7 /100 | #106 | Exceptional 49.3% |
| Syrians | 96.7 /100 | #107 | Exceptional 49.3% |
| Jordanians | 96.6 /100 | #108 | Exceptional 49.2% |
| Immigrants | Morocco | 96.3 /100 | #109 | Exceptional 49.2% |
| Austrians | 95.8 /100 | #110 | Exceptional 49.1% |
| Immigrants | Venezuela | 95.8 /100 | #111 | Exceptional 49.1% |
| Immigrants | Chile | 95.3 /100 | #112 | Exceptional 49.0% |
Demographics Similar to Immigrants from Cuba by Associate's Degree
In terms of associate's degree, the demographic groups most similar to Immigrants from Cuba are Aleut (39.6%, a difference of 0.24%), Central American (39.4%, a difference of 0.26%), Immigrants from Caribbean (39.7%, a difference of 0.50%), Immigrants from Haiti (39.3%, a difference of 0.71%), and Dominican (39.3%, a difference of 0.72%).
| Demographics | Rating | Rank | Associate's Degree |
| Immigrants | Portugal | 0.1 /100 | #281 | Tragic 40.1% |
| Bangladeshis | 0.1 /100 | #282 | Tragic 40.0% |
| Haitians | 0.1 /100 | #283 | Tragic 40.0% |
| Comanche | 0.1 /100 | #284 | Tragic 39.9% |
| Immigrants | Belize | 0.1 /100 | #285 | Tragic 39.9% |
| Immigrants | Caribbean | 0.0 /100 | #286 | Tragic 39.7% |
| Aleuts | 0.0 /100 | #287 | Tragic 39.6% |
| Immigrants | Cuba | 0.0 /100 | #288 | Tragic 39.5% |
| Central Americans | 0.0 /100 | #289 | Tragic 39.4% |
| Immigrants | Haiti | 0.0 /100 | #290 | Tragic 39.3% |
| Dominicans | 0.0 /100 | #291 | Tragic 39.3% |
| Blacks/African Americans | 0.0 /100 | #292 | Tragic 39.1% |
| Nepalese | 0.0 /100 | #293 | Tragic 39.0% |
| Salvadorans | 0.0 /100 | #294 | Tragic 39.0% |
| Hondurans | 0.0 /100 | #295 | Tragic 38.9% |