Tsimshian vs Cree Median Male Earnings
COMPARE
Tsimshian
Cree
Median Male Earnings
Median Male Earnings Comparison
Tsimshian
Cree
$48,836
MEDIAN MALE EARNINGS
0.4/ 100
METRIC RATING
269th/ 347
METRIC RANK
$49,497
MEDIAN MALE EARNINGS
0.7/ 100
METRIC RATING
258th/ 347
METRIC RANK
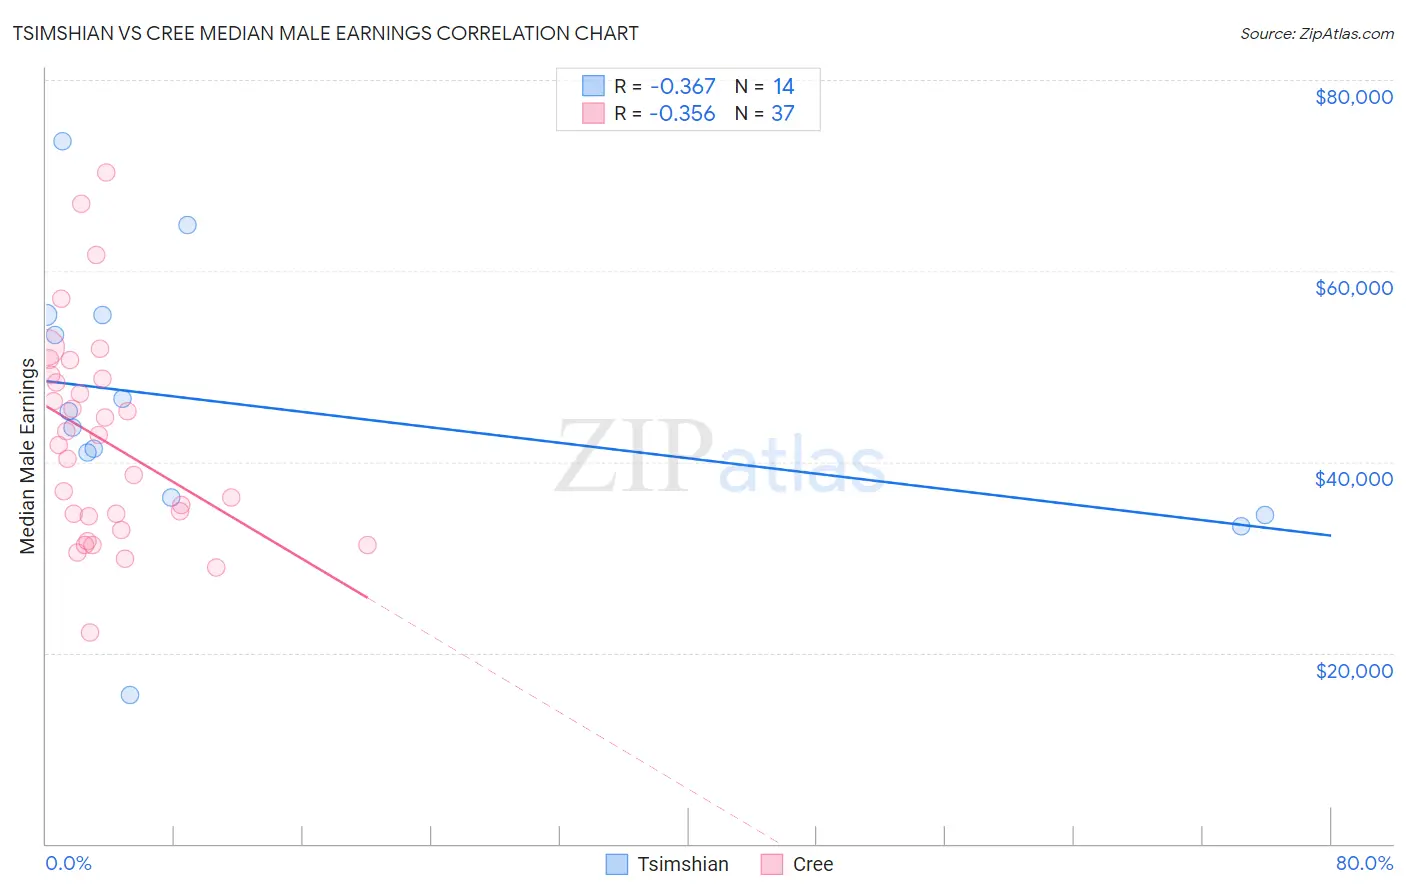
Tsimshian vs Cree Median Male Earnings Correlation Chart
The statistical analysis conducted on geographies consisting of 15,625,423 people shows a mild negative correlation between the proportion of Tsimshian and median male earnings in the United States with a correlation coefficient (R) of -0.367 and weighted average of $48,836. Similarly, the statistical analysis conducted on geographies consisting of 76,198,776 people shows a mild negative correlation between the proportion of Cree and median male earnings in the United States with a correlation coefficient (R) of -0.356 and weighted average of $49,497, a difference of 1.3%.
Median Male Earnings Correlation Summary
| Measurement | Tsimshian | Cree |
| Minimum | $15,625 | $22,163 |
| Maximum | $73,588 | $70,294 |
| Range | $57,963 | $48,131 |
| Mean | $45,710 | $42,158 |
| Median | $44,489 | $41,730 |
| Interquartile 25% (IQ1) | $36,250 | $33,580 |
| Interquartile 75% (IQ3) | $55,386 | $48,892 |
| Interquartile Range (IQR) | $19,136 | $15,312 |
| Standard Deviation (Sample) | $14,437 | $10,951 |
| Standard Deviation (Population) | $13,911 | $10,802 |
Demographics Similar to Tsimshian and Cree by Median Male Earnings
In terms of median male earnings, the demographic groups most similar to Tsimshian are Ute ($48,899, a difference of 0.13%), Potawatomi ($48,768, a difference of 0.14%), Cherokee ($48,669, a difference of 0.34%), Spanish American ($49,008, a difference of 0.35%), and Somali ($49,025, a difference of 0.39%). Similarly, the demographic groups most similar to Cree are Nepalese ($49,458, a difference of 0.080%), Iroquois ($49,374, a difference of 0.25%), British West Indian ($49,636, a difference of 0.28%), Liberian ($49,318, a difference of 0.36%), and Alaska Native ($49,711, a difference of 0.43%).
| Demographics | Rating | Rank | Median Male Earnings |
| German Russians | 1.1 /100 | #253 | Tragic $49,924 |
| Senegalese | 1.0 /100 | #254 | Tragic $49,774 |
| Alaskan Athabascans | 0.9 /100 | #255 | Tragic $49,748 |
| Alaska Natives | 0.9 /100 | #256 | Tragic $49,711 |
| British West Indians | 0.8 /100 | #257 | Tragic $49,636 |
| Cree | 0.7 /100 | #258 | Tragic $49,497 |
| Nepalese | 0.7 /100 | #259 | Tragic $49,458 |
| Iroquois | 0.7 /100 | #260 | Tragic $49,374 |
| Liberians | 0.6 /100 | #261 | Tragic $49,318 |
| Immigrants | West Indies | 0.6 /100 | #262 | Tragic $49,271 |
| Nicaraguans | 0.6 /100 | #263 | Tragic $49,215 |
| Immigrants | Middle Africa | 0.6 /100 | #264 | Tragic $49,201 |
| Immigrants | Laos | 0.6 /100 | #265 | Tragic $49,190 |
| Somalis | 0.5 /100 | #266 | Tragic $49,025 |
| Spanish Americans | 0.5 /100 | #267 | Tragic $49,008 |
| Ute | 0.4 /100 | #268 | Tragic $48,899 |
| Tsimshian | 0.4 /100 | #269 | Tragic $48,836 |
| Potawatomi | 0.4 /100 | #270 | Tragic $48,768 |
| Cherokee | 0.3 /100 | #271 | Tragic $48,669 |
| Salvadorans | 0.3 /100 | #272 | Tragic $48,646 |
| Jamaicans | 0.3 /100 | #273 | Tragic $48,632 |