Nonimmigrants vs Immigrants from Senegal Median Family Income
COMPARE
Nonimmigrants
Immigrants from Senegal
Median Family Income
Median Family Income Comparison
Nonimmigrants
Immigrants from Senegal
$96,231
MEDIAN FAMILY INCOME
3.6/ 100
METRIC RATING
224th/ 347
METRIC RANK
$92,912
MEDIAN FAMILY INCOME
0.7/ 100
METRIC RATING
247th/ 347
METRIC RANK
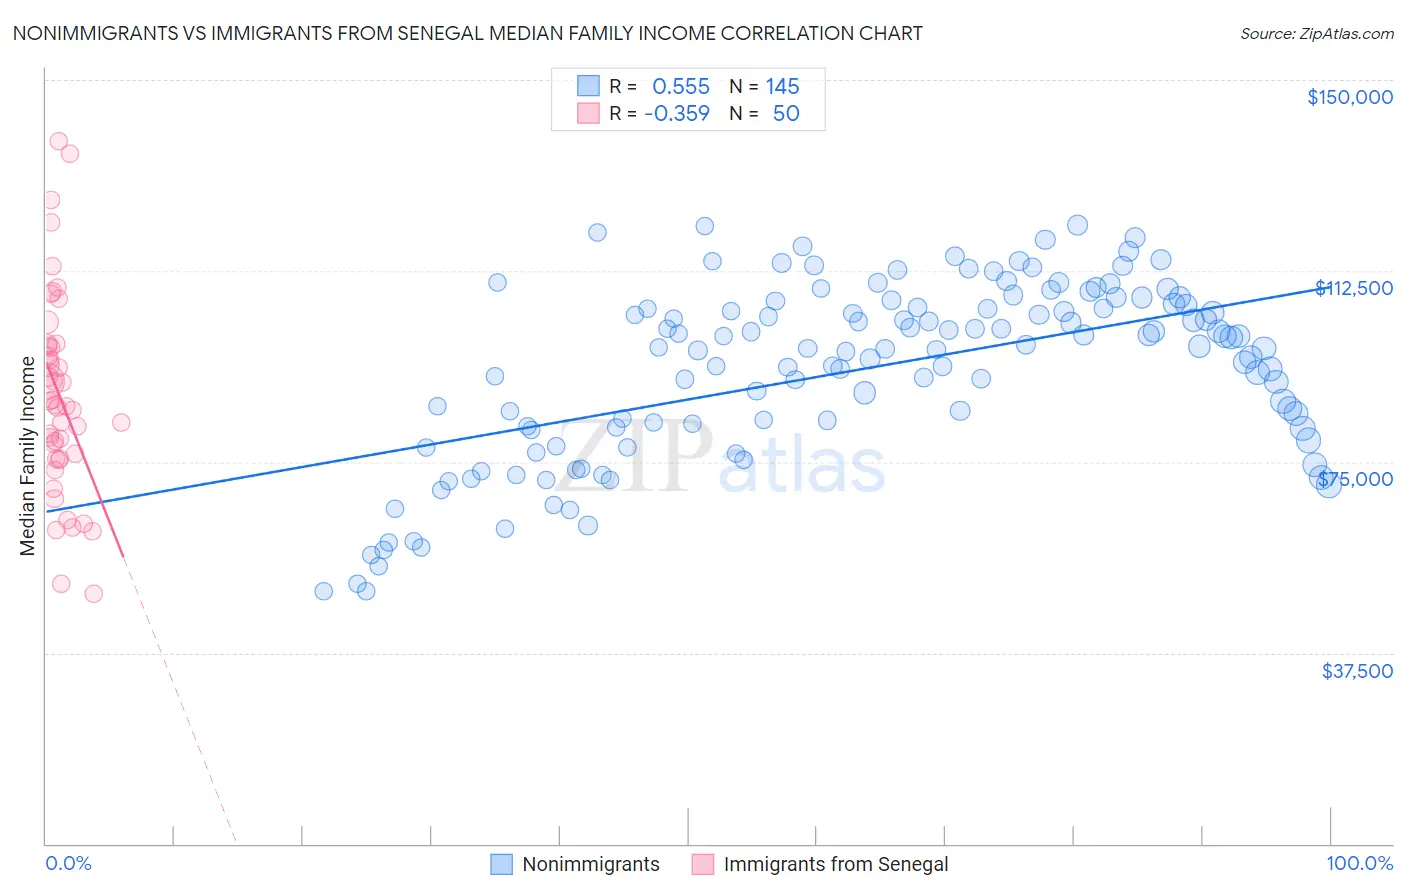
Nonimmigrants vs Immigrants from Senegal Median Family Income Correlation Chart
The statistical analysis conducted on geographies consisting of 582,429,666 people shows a substantial positive correlation between the proportion of Nonimmigrants and median family income in the United States with a correlation coefficient (R) of 0.555 and weighted average of $96,231. Similarly, the statistical analysis conducted on geographies consisting of 90,105,018 people shows a mild negative correlation between the proportion of Immigrants from Senegal and median family income in the United States with a correlation coefficient (R) of -0.359 and weighted average of $92,912, a difference of 3.6%.
Median Family Income Correlation Summary
| Measurement | Nonimmigrants | Immigrants from Senegal |
| Minimum | $49,547 | $49,167 |
| Maximum | $121,513 | $137,892 |
| Range | $71,966 | $88,725 |
| Mean | $93,127 | $87,849 |
| Median | $97,277 | $85,966 |
| Interquartile 25% (IQ1) | $81,657 | $75,730 |
| Interquartile 75% (IQ3) | $105,547 | $97,800 |
| Interquartile Range (IQR) | $23,890 | $22,070 |
| Standard Deviation (Sample) | $17,276 | $19,522 |
| Standard Deviation (Population) | $17,216 | $19,326 |
Similar Demographics by Median Family Income
Demographics Similar to Nonimmigrants by Median Family Income
In terms of median family income, the demographic groups most similar to Nonimmigrants are Venezuelan ($96,281, a difference of 0.050%), Vietnamese ($96,123, a difference of 0.11%), Immigrants from Nigeria ($96,439, a difference of 0.22%), Immigrants from Ghana ($96,544, a difference of 0.33%), and Sudanese ($96,783, a difference of 0.57%).
| Demographics | Rating | Rank | Median Family Income |
| Japanese | 6.0 /100 | #217 | Tragic $97,288 |
| Immigrants | Cambodia | 5.8 /100 | #218 | Tragic $97,222 |
| Delaware | 5.1 /100 | #219 | Tragic $96,958 |
| Sudanese | 4.7 /100 | #220 | Tragic $96,783 |
| Immigrants | Ghana | 4.2 /100 | #221 | Tragic $96,544 |
| Immigrants | Nigeria | 4.0 /100 | #222 | Tragic $96,439 |
| Venezuelans | 3.7 /100 | #223 | Tragic $96,281 |
| Immigrants | Nonimmigrants | 3.6 /100 | #224 | Tragic $96,231 |
| Vietnamese | 3.4 /100 | #225 | Tragic $96,123 |
| Immigrants | Panama | 2.7 /100 | #226 | Tragic $95,647 |
| Alaska Natives | 2.6 /100 | #227 | Tragic $95,573 |
| Immigrants | Azores | 2.4 /100 | #228 | Tragic $95,402 |
| Marshallese | 2.2 /100 | #229 | Tragic $95,293 |
| Malaysians | 2.2 /100 | #230 | Tragic $95,230 |
| Ecuadorians | 2.1 /100 | #231 | Tragic $95,114 |
Demographics Similar to Immigrants from Senegal by Median Family Income
In terms of median family income, the demographic groups most similar to Immigrants from Senegal are French American Indian ($92,872, a difference of 0.040%), Immigrants from Ecuador ($92,837, a difference of 0.080%), West Indian ($92,765, a difference of 0.16%), Immigrants from Somalia ($92,609, a difference of 0.33%), and Immigrants from El Salvador ($92,545, a difference of 0.40%).
| Demographics | Rating | Rank | Median Family Income |
| Somalis | 1.2 /100 | #240 | Tragic $94,085 |
| Immigrants | Trinidad and Tobago | 1.2 /100 | #241 | Tragic $93,988 |
| Barbadians | 1.1 /100 | #242 | Tragic $93,919 |
| German Russians | 1.1 /100 | #243 | Tragic $93,858 |
| Sub-Saharan Africans | 1.0 /100 | #244 | Tragic $93,748 |
| Immigrants | Middle Africa | 1.0 /100 | #245 | Tragic $93,593 |
| Guyanese | 0.9 /100 | #246 | Tragic $93,373 |
| Immigrants | Senegal | 0.7 /100 | #247 | Tragic $92,912 |
| French American Indians | 0.7 /100 | #248 | Tragic $92,872 |
| Immigrants | Ecuador | 0.7 /100 | #249 | Tragic $92,837 |
| West Indians | 0.6 /100 | #250 | Tragic $92,765 |
| Immigrants | Somalia | 0.6 /100 | #251 | Tragic $92,609 |
| Immigrants | El Salvador | 0.6 /100 | #252 | Tragic $92,545 |
| Immigrants | Guyana | 0.6 /100 | #253 | Tragic $92,513 |
| Immigrants | Barbados | 0.5 /100 | #254 | Tragic $92,419 |