Immigrants from Dominican Republic vs Immigrants from Cabo Verde Median Male Earnings
COMPARE
Immigrants from Dominican Republic
Immigrants from Cabo Verde
Median Male Earnings
Median Male Earnings Comparison
Immigrants from Dominican Republic
Immigrants from Cabo Verde
$46,655
MEDIAN MALE EARNINGS
0.0/ 100
METRIC RATING
307th/ 347
METRIC RANK
$50,009
MEDIAN MALE EARNINGS
1.2/ 100
METRIC RATING
252nd/ 347
METRIC RANK
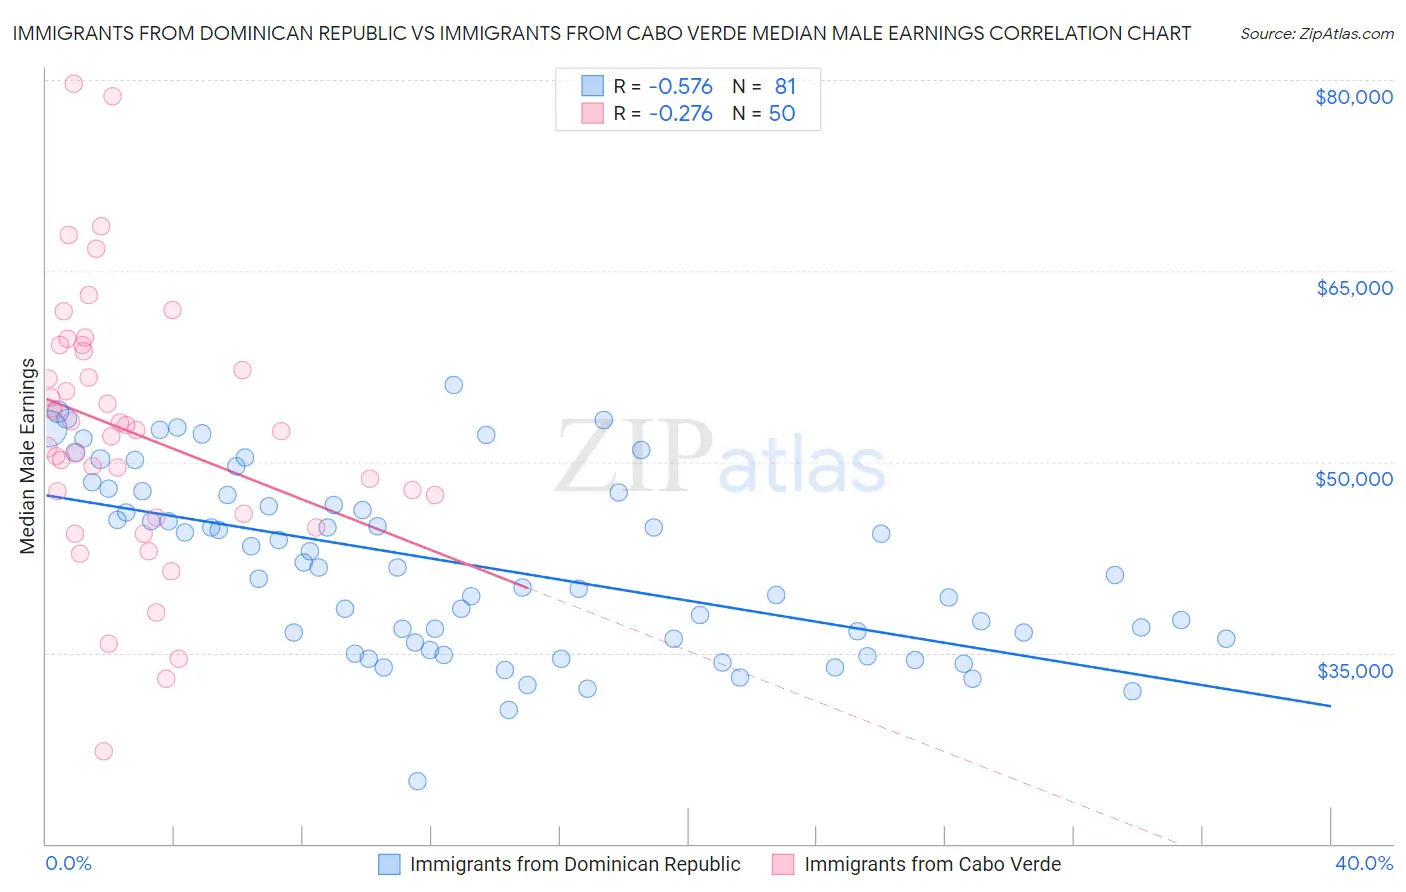
Immigrants from Dominican Republic vs Immigrants from Cabo Verde Median Male Earnings Correlation Chart
The statistical analysis conducted on geographies consisting of 274,998,271 people shows a substantial negative correlation between the proportion of Immigrants from Dominican Republic and median male earnings in the United States with a correlation coefficient (R) of -0.576 and weighted average of $46,655. Similarly, the statistical analysis conducted on geographies consisting of 38,152,357 people shows a weak negative correlation between the proportion of Immigrants from Cabo Verde and median male earnings in the United States with a correlation coefficient (R) of -0.276 and weighted average of $50,009, a difference of 7.2%.
Median Male Earnings Correlation Summary
| Measurement | Immigrants from Dominican Republic | Immigrants from Cabo Verde |
| Minimum | $24,931 | $27,292 |
| Maximum | $56,014 | $79,684 |
| Range | $31,083 | $52,392 |
| Mean | $41,875 | $52,373 |
| Median | $41,710 | $52,422 |
| Interquartile 25% (IQ1) | $35,983 | $45,929 |
| Interquartile 75% (IQ3) | $47,499 | $58,666 |
| Interquartile Range (IQR) | $11,516 | $12,737 |
| Standard Deviation (Sample) | $7,016 | $10,362 |
| Standard Deviation (Population) | $6,972 | $10,258 |
Similar Demographics by Median Male Earnings
Demographics Similar to Immigrants from Dominican Republic by Median Male Earnings
In terms of median male earnings, the demographic groups most similar to Immigrants from Dominican Republic are Dutch West Indian ($46,656, a difference of 0.0%), Ottawa ($46,611, a difference of 0.090%), Creek ($46,594, a difference of 0.13%), Cuban ($46,580, a difference of 0.16%), and Guatemalan ($46,736, a difference of 0.17%).
| Demographics | Rating | Rank | Median Male Earnings |
| U.S. Virgin Islanders | 0.1 /100 | #300 | Tragic $47,066 |
| Immigrants | Latin America | 0.1 /100 | #301 | Tragic $46,941 |
| Seminole | 0.1 /100 | #302 | Tragic $46,783 |
| Yaqui | 0.1 /100 | #303 | Tragic $46,777 |
| Bangladeshis | 0.1 /100 | #304 | Tragic $46,744 |
| Guatemalans | 0.0 /100 | #305 | Tragic $46,736 |
| Dutch West Indians | 0.0 /100 | #306 | Tragic $46,656 |
| Immigrants | Dominican Republic | 0.0 /100 | #307 | Tragic $46,655 |
| Ottawa | 0.0 /100 | #308 | Tragic $46,611 |
| Creek | 0.0 /100 | #309 | Tragic $46,594 |
| Cubans | 0.0 /100 | #310 | Tragic $46,580 |
| Apache | 0.0 /100 | #311 | Tragic $46,429 |
| Hispanics or Latinos | 0.0 /100 | #312 | Tragic $46,419 |
| Hondurans | 0.0 /100 | #313 | Tragic $46,374 |
| Chippewa | 0.0 /100 | #314 | Tragic $46,368 |
Demographics Similar to Immigrants from Cabo Verde by Median Male Earnings
In terms of median male earnings, the demographic groups most similar to Immigrants from Cabo Verde are German Russian ($49,924, a difference of 0.17%), Senegalese ($49,774, a difference of 0.47%), Alaskan Athabascan ($49,748, a difference of 0.52%), Immigrants from Grenada ($50,279, a difference of 0.54%), and Osage ($50,292, a difference of 0.57%).
| Demographics | Rating | Rank | Median Male Earnings |
| Hawaiians | 1.9 /100 | #245 | Tragic $50,488 |
| Immigrants | Ecuador | 1.9 /100 | #246 | Tragic $50,474 |
| Sub-Saharan Africans | 1.8 /100 | #247 | Tragic $50,408 |
| Immigrants | Guyana | 1.6 /100 | #248 | Tragic $50,321 |
| Immigrants | Burma/Myanmar | 1.6 /100 | #249 | Tragic $50,298 |
| Osage | 1.6 /100 | #250 | Tragic $50,292 |
| Immigrants | Grenada | 1.6 /100 | #251 | Tragic $50,279 |
| Immigrants | Cabo Verde | 1.2 /100 | #252 | Tragic $50,009 |
| German Russians | 1.1 /100 | #253 | Tragic $49,924 |
| Senegalese | 1.0 /100 | #254 | Tragic $49,774 |
| Alaskan Athabascans | 0.9 /100 | #255 | Tragic $49,748 |
| Alaska Natives | 0.9 /100 | #256 | Tragic $49,711 |
| British West Indians | 0.8 /100 | #257 | Tragic $49,636 |
| Cree | 0.7 /100 | #258 | Tragic $49,497 |
| Nepalese | 0.7 /100 | #259 | Tragic $49,458 |