Black/African American vs Immigrants from Sweden Median Household Income
COMPARE
Black/African American
Immigrants from Sweden
Median Household Income
Median Household Income Comparison
Blacks/African Americans
Immigrants from Sweden
$67,573
MEDIAN HOUSEHOLD INCOME
0.0/ 100
METRIC RATING
334th/ 347
METRIC RANK
$100,699
MEDIAN HOUSEHOLD INCOME
100.0/ 100
METRIC RATING
25th/ 347
METRIC RANK
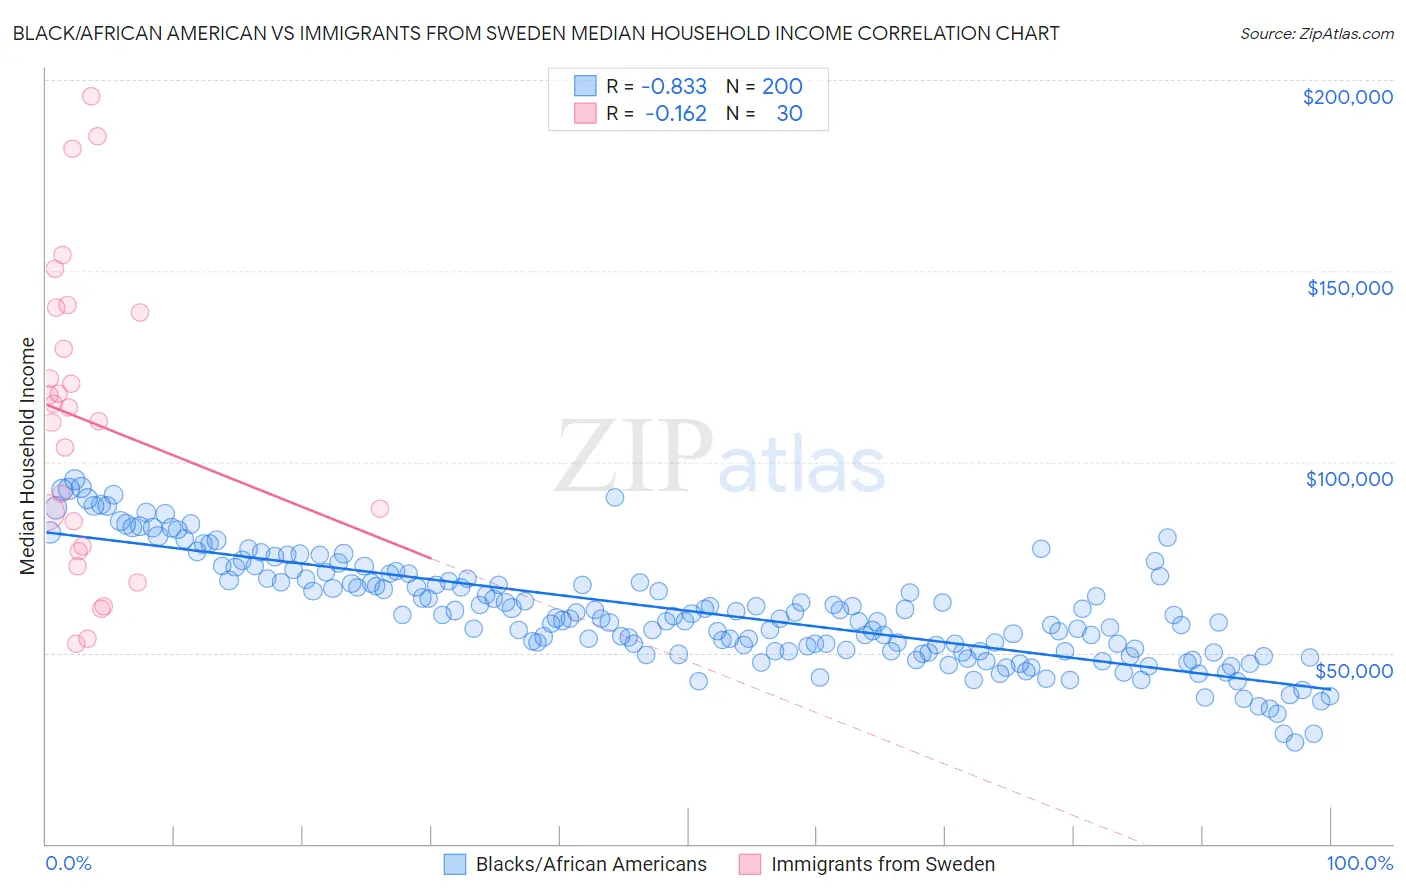
Black/African American vs Immigrants from Sweden Median Household Income Correlation Chart
The statistical analysis conducted on geographies consisting of 564,831,998 people shows a very strong negative correlation between the proportion of Blacks/African Americans and median household income in the United States with a correlation coefficient (R) of -0.833 and weighted average of $67,573. Similarly, the statistical analysis conducted on geographies consisting of 164,698,337 people shows a poor negative correlation between the proportion of Immigrants from Sweden and median household income in the United States with a correlation coefficient (R) of -0.162 and weighted average of $100,699, a difference of 49.0%.
Median Household Income Correlation Summary
| Measurement | Black/African American | Immigrants from Sweden |
| Minimum | $26,476 | $52,323 |
| Maximum | $95,304 | $195,586 |
| Range | $68,828 | $143,263 |
| Mean | $60,966 | $110,867 |
| Median | $59,295 | $112,526 |
| Interquartile 25% (IQ1) | $50,395 | $78,036 |
| Interquartile 75% (IQ3) | $69,686 | $139,219 |
| Interquartile Range (IQR) | $19,291 | $61,183 |
| Standard Deviation (Sample) | $14,297 | $38,839 |
| Standard Deviation (Population) | $14,261 | $38,186 |
Similar Demographics by Median Household Income
Demographics Similar to Blacks/African Americans by Median Household Income
In terms of median household income, the demographic groups most similar to Blacks/African Americans are Creek ($67,715, a difference of 0.21%), Sioux ($67,792, a difference of 0.32%), Native/Alaskan ($67,879, a difference of 0.45%), Arapaho ($67,965, a difference of 0.58%), and Cheyenne ($66,974, a difference of 0.89%).
| Demographics | Rating | Rank | Median Household Income |
| Immigrants | Cuba | 0.0 /100 | #327 | Tragic $68,461 |
| Menominee | 0.0 /100 | #328 | Tragic $68,423 |
| Dutch West Indians | 0.0 /100 | #329 | Tragic $68,412 |
| Arapaho | 0.0 /100 | #330 | Tragic $67,965 |
| Natives/Alaskans | 0.0 /100 | #331 | Tragic $67,879 |
| Sioux | 0.0 /100 | #332 | Tragic $67,792 |
| Creek | 0.0 /100 | #333 | Tragic $67,715 |
| Blacks/African Americans | 0.0 /100 | #334 | Tragic $67,573 |
| Cheyenne | 0.0 /100 | #335 | Tragic $66,974 |
| Immigrants | Congo | 0.0 /100 | #336 | Tragic $66,768 |
| Kiowa | 0.0 /100 | #337 | Tragic $65,914 |
| Immigrants | Yemen | 0.0 /100 | #338 | Tragic $65,194 |
| Hopi | 0.0 /100 | #339 | Tragic $65,043 |
| Pueblo | 0.0 /100 | #340 | Tragic $64,692 |
| Crow | 0.0 /100 | #341 | Tragic $63,681 |
Demographics Similar to Immigrants from Sweden by Median Household Income
In terms of median household income, the demographic groups most similar to Immigrants from Sweden are Immigrants from Japan ($100,711, a difference of 0.010%), Immigrants from Belgium ($100,306, a difference of 0.39%), Bhutanese ($100,151, a difference of 0.55%), Immigrants from Bolivia ($101,394, a difference of 0.69%), and Immigrants from Sri Lanka ($99,943, a difference of 0.76%).
| Demographics | Rating | Rank | Median Household Income |
| Cypriots | 100.0 /100 | #18 | Exceptional $102,843 |
| Immigrants | Australia | 100.0 /100 | #19 | Exceptional $102,562 |
| Bolivians | 100.0 /100 | #20 | Exceptional $102,195 |
| Eastern Europeans | 100.0 /100 | #21 | Exceptional $101,781 |
| Asians | 100.0 /100 | #22 | Exceptional $101,681 |
| Immigrants | Bolivia | 100.0 /100 | #23 | Exceptional $101,394 |
| Immigrants | Japan | 100.0 /100 | #24 | Exceptional $100,711 |
| Immigrants | Sweden | 100.0 /100 | #25 | Exceptional $100,699 |
| Immigrants | Belgium | 100.0 /100 | #26 | Exceptional $100,306 |
| Bhutanese | 100.0 /100 | #27 | Exceptional $100,151 |
| Immigrants | Sri Lanka | 100.0 /100 | #28 | Exceptional $99,943 |
| Immigrants | Asia | 100.0 /100 | #29 | Exceptional $99,933 |
| Immigrants | Northern Europe | 100.0 /100 | #30 | Exceptional $99,813 |
| Turks | 100.0 /100 | #31 | Exceptional $99,389 |
| Immigrants | Denmark | 100.0 /100 | #32 | Exceptional $98,510 |