Canadian vs Immigrants from Sweden Median Male Earnings
COMPARE
Canadian
Immigrants from Sweden
Median Male Earnings
Median Male Earnings Comparison
Canadians
Immigrants from Sweden
$57,286
MEDIAN MALE EARNINGS
93.9/ 100
METRIC RATING
120th/ 347
METRIC RANK
$65,406
MEDIAN MALE EARNINGS
100.0/ 100
METRIC RATING
21st/ 347
METRIC RANK
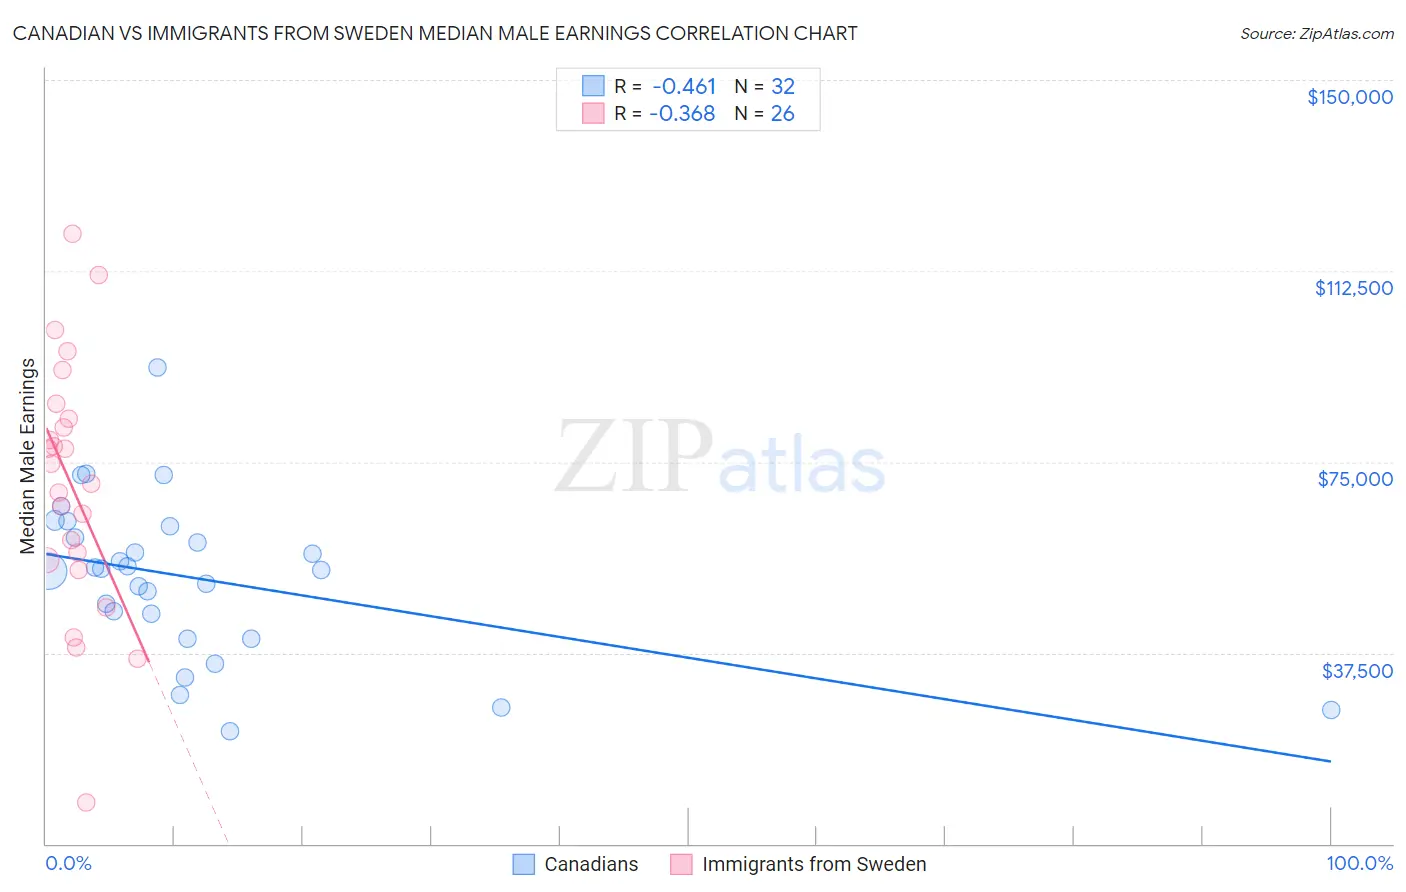
Canadian vs Immigrants from Sweden Median Male Earnings Correlation Chart
The statistical analysis conducted on geographies consisting of 437,343,758 people shows a moderate negative correlation between the proportion of Canadians and median male earnings in the United States with a correlation coefficient (R) of -0.461 and weighted average of $57,286. Similarly, the statistical analysis conducted on geographies consisting of 164,719,286 people shows a mild negative correlation between the proportion of Immigrants from Sweden and median male earnings in the United States with a correlation coefficient (R) of -0.368 and weighted average of $65,406, a difference of 14.2%.
Median Male Earnings Correlation Summary
| Measurement | Canadian | Immigrants from Sweden |
| Minimum | $22,125 | $8,107 |
| Maximum | $93,638 | $119,732 |
| Range | $71,513 | $111,625 |
| Mean | $52,093 | $70,306 |
| Median | $53,822 | $72,770 |
| Interquartile 25% (IQ1) | $42,789 | $55,777 |
| Interquartile 75% (IQ3) | $61,239 | $83,429 |
| Interquartile Range (IQR) | $18,449 | $27,652 |
| Standard Deviation (Sample) | $15,572 | $24,867 |
| Standard Deviation (Population) | $15,327 | $24,384 |
Similar Demographics by Median Male Earnings
Demographics Similar to Canadians by Median Male Earnings
In terms of median male earnings, the demographic groups most similar to Canadians are Arab ($57,298, a difference of 0.020%), Hungarian ($57,309, a difference of 0.040%), Immigrants from Zimbabwe ($57,352, a difference of 0.12%), Immigrants from Albania ($57,179, a difference of 0.19%), and Lebanese ($57,409, a difference of 0.22%).
| Demographics | Rating | Rank | Median Male Earnings |
| Carpatho Rusyns | 95.3 /100 | #113 | Exceptional $57,572 |
| Immigrants | Kuwait | 95.3 /100 | #114 | Exceptional $57,562 |
| Swedes | 94.8 /100 | #115 | Exceptional $57,445 |
| Lebanese | 94.6 /100 | #116 | Exceptional $57,409 |
| Immigrants | Zimbabwe | 94.3 /100 | #117 | Exceptional $57,352 |
| Hungarians | 94.0 /100 | #118 | Exceptional $57,309 |
| Arabs | 94.0 /100 | #119 | Exceptional $57,298 |
| Canadians | 93.9 /100 | #120 | Exceptional $57,286 |
| Immigrants | Albania | 93.3 /100 | #121 | Exceptional $57,179 |
| Immigrants | Jordan | 93.1 /100 | #122 | Exceptional $57,145 |
| Slovenes | 93.1 /100 | #123 | Exceptional $57,145 |
| Chileans | 91.9 /100 | #124 | Exceptional $56,973 |
| Immigrants | Morocco | 91.8 /100 | #125 | Exceptional $56,958 |
| Chinese | 91.1 /100 | #126 | Exceptional $56,872 |
| Brazilians | 90.9 /100 | #127 | Exceptional $56,837 |
Demographics Similar to Immigrants from Sweden by Median Male Earnings
In terms of median male earnings, the demographic groups most similar to Immigrants from Sweden are Immigrants from Japan ($65,518, a difference of 0.17%), Cypriot ($65,549, a difference of 0.22%), Burmese ($65,236, a difference of 0.26%), Immigrants from Korea ($65,079, a difference of 0.50%), and Immigrants from Northern Europe ($64,987, a difference of 0.65%).
| Demographics | Rating | Rank | Median Male Earnings |
| Okinawans | 100.0 /100 | #14 | Exceptional $67,232 |
| Immigrants | Eastern Asia | 100.0 /100 | #15 | Exceptional $66,903 |
| Eastern Europeans | 100.0 /100 | #16 | Exceptional $66,472 |
| Immigrants | Belgium | 100.0 /100 | #17 | Exceptional $66,125 |
| Indians (Asian) | 100.0 /100 | #18 | Exceptional $66,078 |
| Cypriots | 100.0 /100 | #19 | Exceptional $65,549 |
| Immigrants | Japan | 100.0 /100 | #20 | Exceptional $65,518 |
| Immigrants | Sweden | 100.0 /100 | #21 | Exceptional $65,406 |
| Burmese | 100.0 /100 | #22 | Exceptional $65,236 |
| Immigrants | Korea | 100.0 /100 | #23 | Exceptional $65,079 |
| Immigrants | Northern Europe | 100.0 /100 | #24 | Exceptional $64,987 |
| Immigrants | Denmark | 100.0 /100 | #25 | Exceptional $64,625 |
| Turks | 100.0 /100 | #26 | Exceptional $64,253 |
| Immigrants | Switzerland | 100.0 /100 | #27 | Exceptional $63,944 |
| Russians | 100.0 /100 | #28 | Exceptional $63,939 |