Cypriot vs Immigrants from Sweden Median Household Income
COMPARE
Cypriot
Immigrants from Sweden
Median Household Income
Median Household Income Comparison
Cypriots
Immigrants from Sweden
$102,843
MEDIAN HOUSEHOLD INCOME
100.0/ 100
METRIC RATING
18th/ 347
METRIC RANK
$100,699
MEDIAN HOUSEHOLD INCOME
100.0/ 100
METRIC RATING
25th/ 347
METRIC RANK
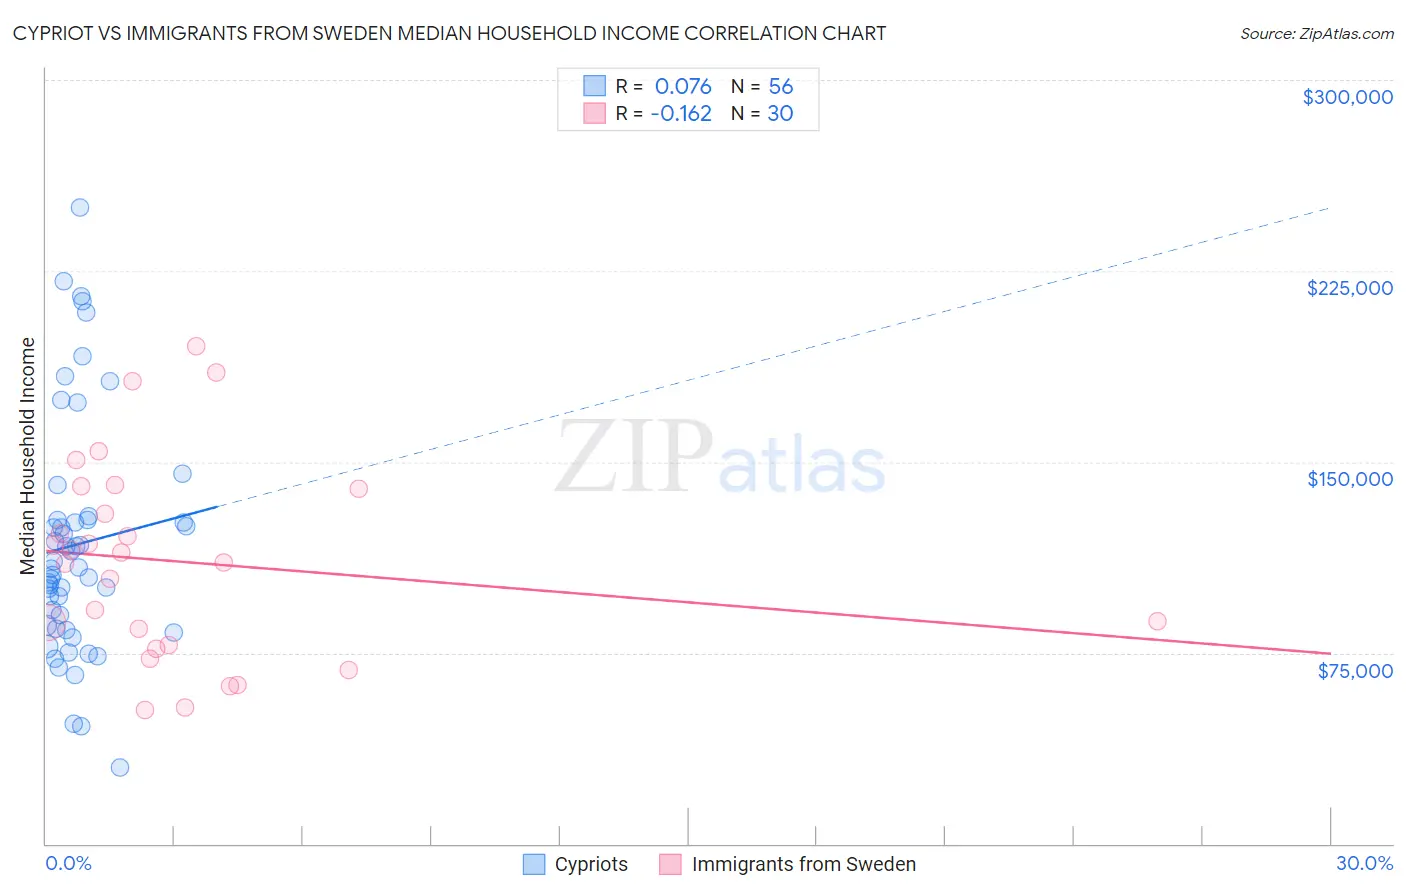
Cypriot vs Immigrants from Sweden Median Household Income Correlation Chart
The statistical analysis conducted on geographies consisting of 61,845,026 people shows a slight positive correlation between the proportion of Cypriots and median household income in the United States with a correlation coefficient (R) of 0.076 and weighted average of $102,843. Similarly, the statistical analysis conducted on geographies consisting of 164,698,337 people shows a poor negative correlation between the proportion of Immigrants from Sweden and median household income in the United States with a correlation coefficient (R) of -0.162 and weighted average of $100,699, a difference of 2.1%.
Median Household Income Correlation Summary
| Measurement | Cypriot | Immigrants from Sweden |
| Minimum | $30,029 | $52,323 |
| Maximum | $250,001 | $195,586 |
| Range | $219,972 | $143,263 |
| Mean | $117,612 | $110,867 |
| Median | $108,270 | $112,526 |
| Interquartile 25% (IQ1) | $84,969 | $78,036 |
| Interquartile 75% (IQ3) | $127,095 | $139,219 |
| Interquartile Range (IQR) | $42,126 | $61,183 |
| Standard Deviation (Sample) | $46,602 | $38,839 |
| Standard Deviation (Population) | $46,184 | $38,186 |
Demographics Similar to Cypriots and Immigrants from Sweden by Median Household Income
In terms of median household income, the demographic groups most similar to Cypriots are Immigrants from Korea ($102,962, a difference of 0.12%), Immigrants from Australia ($102,562, a difference of 0.27%), Burmese ($103,145, a difference of 0.29%), Bolivian ($102,195, a difference of 0.63%), and Eastern European ($101,781, a difference of 1.0%). Similarly, the demographic groups most similar to Immigrants from Sweden are Immigrants from Japan ($100,711, a difference of 0.010%), Immigrants from Belgium ($100,306, a difference of 0.39%), Bhutanese ($100,151, a difference of 0.55%), Immigrants from Bolivia ($101,394, a difference of 0.69%), and Immigrants from Sri Lanka ($99,943, a difference of 0.76%).
| Demographics | Rating | Rank | Median Household Income |
| Immigrants | China | 100.0 /100 | #11 | Exceptional $105,335 |
| Indians (Asian) | 100.0 /100 | #12 | Exceptional $105,262 |
| Immigrants | Eastern Asia | 100.0 /100 | #13 | Exceptional $104,796 |
| Immigrants | Ireland | 100.0 /100 | #14 | Exceptional $104,692 |
| Immigrants | Israel | 100.0 /100 | #15 | Exceptional $104,090 |
| Burmese | 100.0 /100 | #16 | Exceptional $103,145 |
| Immigrants | Korea | 100.0 /100 | #17 | Exceptional $102,962 |
| Cypriots | 100.0 /100 | #18 | Exceptional $102,843 |
| Immigrants | Australia | 100.0 /100 | #19 | Exceptional $102,562 |
| Bolivians | 100.0 /100 | #20 | Exceptional $102,195 |
| Eastern Europeans | 100.0 /100 | #21 | Exceptional $101,781 |
| Asians | 100.0 /100 | #22 | Exceptional $101,681 |
| Immigrants | Bolivia | 100.0 /100 | #23 | Exceptional $101,394 |
| Immigrants | Japan | 100.0 /100 | #24 | Exceptional $100,711 |
| Immigrants | Sweden | 100.0 /100 | #25 | Exceptional $100,699 |
| Immigrants | Belgium | 100.0 /100 | #26 | Exceptional $100,306 |
| Bhutanese | 100.0 /100 | #27 | Exceptional $100,151 |
| Immigrants | Sri Lanka | 100.0 /100 | #28 | Exceptional $99,943 |
| Immigrants | Asia | 100.0 /100 | #29 | Exceptional $99,933 |
| Immigrants | Northern Europe | 100.0 /100 | #30 | Exceptional $99,813 |
| Turks | 100.0 /100 | #31 | Exceptional $99,389 |