Bahamian vs Bermudan Median Male Earnings
COMPARE
Bahamian
Bermudan
Median Male Earnings
Median Male Earnings Comparison
Bahamians
Bermudans
$44,756
MEDIAN MALE EARNINGS
0.0/ 100
METRIC RATING
332nd/ 347
METRIC RANK
$52,465
MEDIAN MALE EARNINGS
12.1/ 100
METRIC RATING
209th/ 347
METRIC RANK
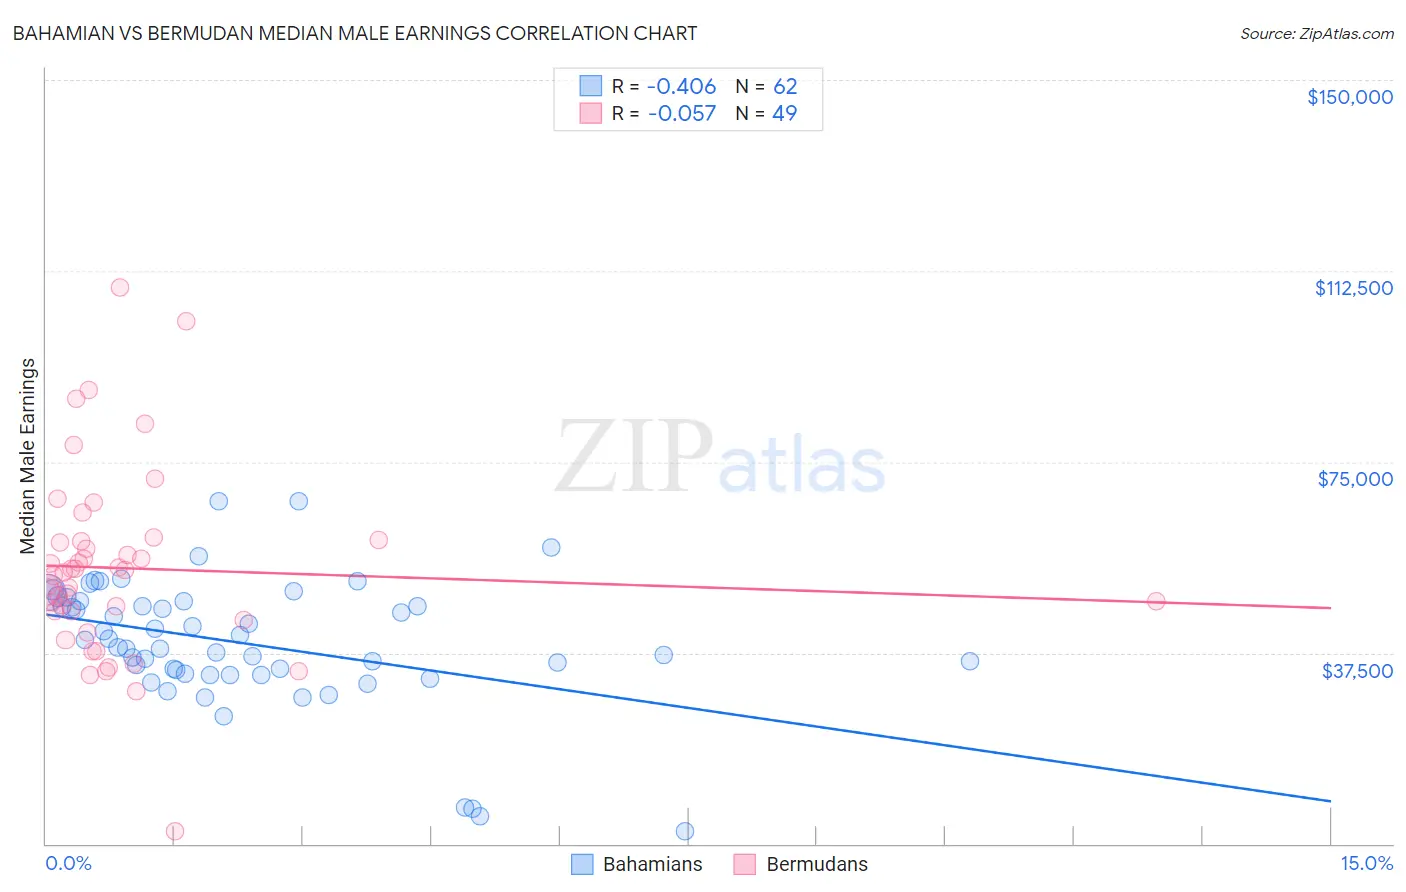
Bahamian vs Bermudan Median Male Earnings Correlation Chart
The statistical analysis conducted on geographies consisting of 112,679,918 people shows a moderate negative correlation between the proportion of Bahamians and median male earnings in the United States with a correlation coefficient (R) of -0.406 and weighted average of $44,756. Similarly, the statistical analysis conducted on geographies consisting of 55,727,224 people shows a slight negative correlation between the proportion of Bermudans and median male earnings in the United States with a correlation coefficient (R) of -0.057 and weighted average of $52,465, a difference of 17.2%.
Median Male Earnings Correlation Summary
| Measurement | Bahamian | Bermudan |
| Minimum | $2,499 | $2,499 |
| Maximum | $67,317 | $109,250 |
| Range | $64,818 | $106,751 |
| Mean | $39,425 | $54,094 |
| Median | $39,316 | $53,290 |
| Interquartile 25% (IQ1) | $33,442 | $44,820 |
| Interquartile 75% (IQ3) | $47,537 | $59,519 |
| Interquartile Range (IQR) | $14,095 | $14,700 |
| Standard Deviation (Sample) | $12,607 | $18,662 |
| Standard Deviation (Population) | $12,505 | $18,471 |
Similar Demographics by Median Male Earnings
Demographics Similar to Bahamians by Median Male Earnings
In terms of median male earnings, the demographic groups most similar to Bahamians are Native/Alaskan ($44,775, a difference of 0.040%), Immigrants from Mexico ($44,960, a difference of 0.46%), Yakama ($45,002, a difference of 0.55%), Kiowa ($45,094, a difference of 0.76%), and Immigrants from Bahamas ($45,176, a difference of 0.94%).
| Demographics | Rating | Rank | Median Male Earnings |
| Yuman | 0.0 /100 | #325 | Tragic $45,446 |
| Immigrants | Haiti | 0.0 /100 | #326 | Tragic $45,266 |
| Immigrants | Bahamas | 0.0 /100 | #327 | Tragic $45,176 |
| Kiowa | 0.0 /100 | #328 | Tragic $45,094 |
| Yakama | 0.0 /100 | #329 | Tragic $45,002 |
| Immigrants | Mexico | 0.0 /100 | #330 | Tragic $44,960 |
| Natives/Alaskans | 0.0 /100 | #331 | Tragic $44,775 |
| Bahamians | 0.0 /100 | #332 | Tragic $44,756 |
| Immigrants | Congo | 0.0 /100 | #333 | Tragic $44,204 |
| Immigrants | Yemen | 0.0 /100 | #334 | Tragic $44,083 |
| Spanish American Indians | 0.0 /100 | #335 | Tragic $44,010 |
| Immigrants | Cuba | 0.0 /100 | #336 | Tragic $43,461 |
| Menominee | 0.0 /100 | #337 | Tragic $42,581 |
| Crow | 0.0 /100 | #338 | Tragic $42,434 |
| Pima | 0.0 /100 | #339 | Tragic $42,357 |
Demographics Similar to Bermudans by Median Male Earnings
In terms of median male earnings, the demographic groups most similar to Bermudans are Venezuelan ($52,510, a difference of 0.090%), Delaware ($52,412, a difference of 0.10%), Vietnamese ($52,525, a difference of 0.11%), Tlingit-Haida ($52,409, a difference of 0.11%), and Cajun ($52,325, a difference of 0.27%).
| Demographics | Rating | Rank | Median Male Earnings |
| Immigrants | Uruguay | 16.8 /100 | #202 | Poor $52,860 |
| Panamanians | 16.5 /100 | #203 | Poor $52,835 |
| Ghanaians | 16.1 /100 | #204 | Poor $52,810 |
| Immigrants | Colombia | 15.0 /100 | #205 | Poor $52,725 |
| Immigrants | Iraq | 14.5 /100 | #206 | Poor $52,681 |
| Vietnamese | 12.7 /100 | #207 | Poor $52,525 |
| Venezuelans | 12.5 /100 | #208 | Poor $52,510 |
| Bermudans | 12.1 /100 | #209 | Poor $52,465 |
| Delaware | 11.5 /100 | #210 | Poor $52,412 |
| Tlingit-Haida | 11.5 /100 | #211 | Poor $52,409 |
| Cajuns | 10.7 /100 | #212 | Poor $52,325 |
| Native Hawaiians | 10.5 /100 | #213 | Poor $52,306 |
| Immigrants | Nonimmigrants | 9.3 /100 | #214 | Tragic $52,170 |
| Immigrants | Cameroon | 8.9 /100 | #215 | Tragic $52,119 |
| Immigrants | Venezuela | 8.3 /100 | #216 | Tragic $52,041 |