Bahamian vs New Zealander Median Male Earnings
COMPARE
Bahamian
New Zealander
Median Male Earnings
Median Male Earnings Comparison
Bahamians
New Zealanders
$44,756
MEDIAN MALE EARNINGS
0.0/ 100
METRIC RATING
332nd/ 347
METRIC RANK
$61,199
MEDIAN MALE EARNINGS
99.9/ 100
METRIC RATING
58th/ 347
METRIC RANK
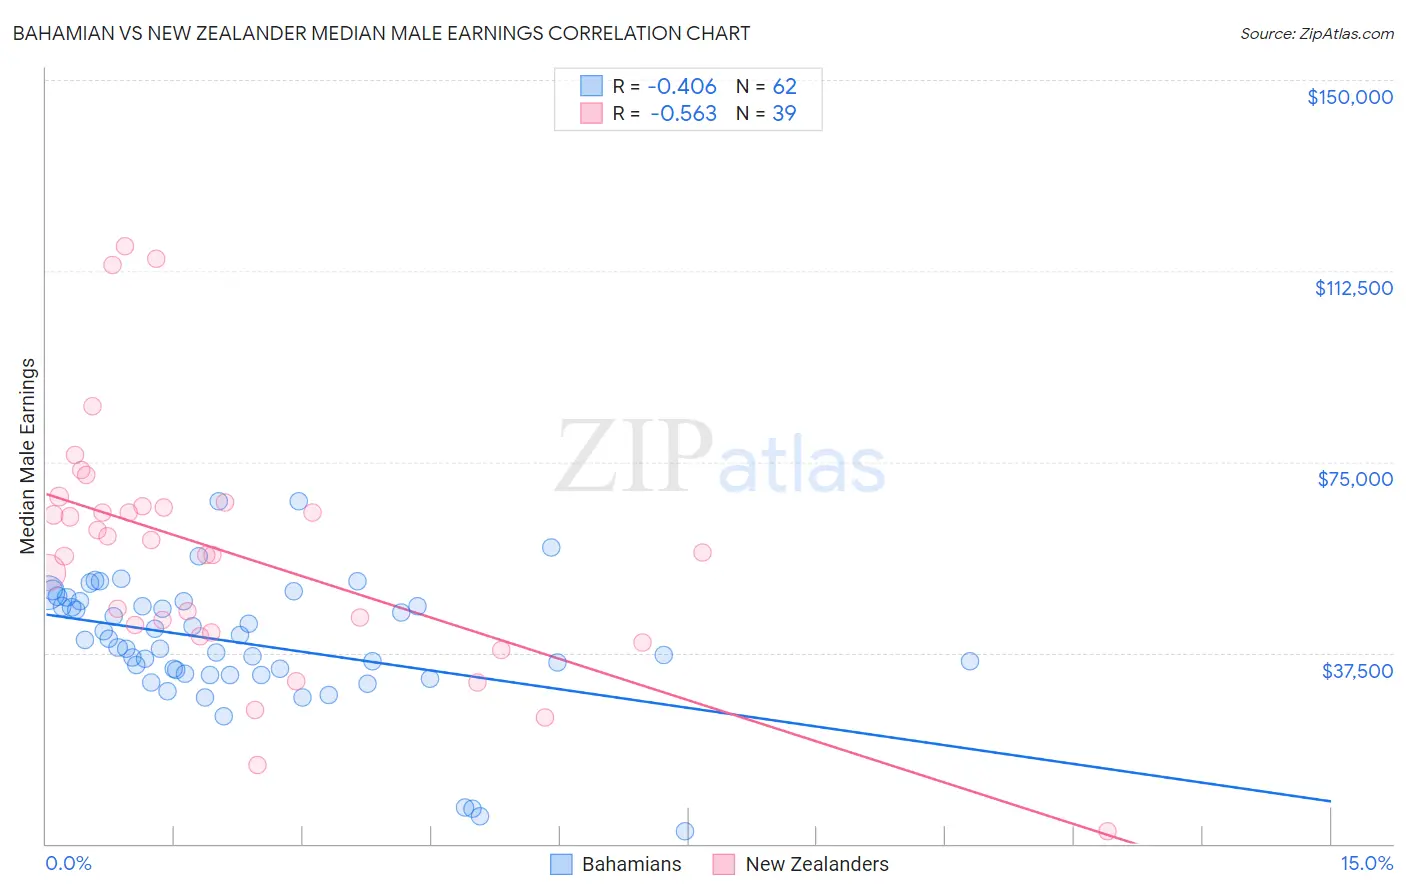
Bahamian vs New Zealander Median Male Earnings Correlation Chart
The statistical analysis conducted on geographies consisting of 112,679,918 people shows a moderate negative correlation between the proportion of Bahamians and median male earnings in the United States with a correlation coefficient (R) of -0.406 and weighted average of $44,756. Similarly, the statistical analysis conducted on geographies consisting of 106,908,736 people shows a substantial negative correlation between the proportion of New Zealanders and median male earnings in the United States with a correlation coefficient (R) of -0.563 and weighted average of $61,199, a difference of 36.7%.
Median Male Earnings Correlation Summary
| Measurement | Bahamian | New Zealander |
| Minimum | $2,499 | $2,499 |
| Maximum | $67,317 | $117,445 |
| Range | $64,818 | $114,946 |
| Mean | $39,425 | $57,008 |
| Median | $39,316 | $57,308 |
| Interquartile 25% (IQ1) | $33,442 | $41,429 |
| Interquartile 75% (IQ3) | $47,537 | $66,406 |
| Interquartile Range (IQR) | $14,095 | $24,977 |
| Standard Deviation (Sample) | $12,607 | $24,372 |
| Standard Deviation (Population) | $12,505 | $24,057 |
Similar Demographics by Median Male Earnings
Demographics Similar to Bahamians by Median Male Earnings
In terms of median male earnings, the demographic groups most similar to Bahamians are Native/Alaskan ($44,775, a difference of 0.040%), Immigrants from Mexico ($44,960, a difference of 0.46%), Yakama ($45,002, a difference of 0.55%), Kiowa ($45,094, a difference of 0.76%), and Immigrants from Bahamas ($45,176, a difference of 0.94%).
| Demographics | Rating | Rank | Median Male Earnings |
| Yuman | 0.0 /100 | #325 | Tragic $45,446 |
| Immigrants | Haiti | 0.0 /100 | #326 | Tragic $45,266 |
| Immigrants | Bahamas | 0.0 /100 | #327 | Tragic $45,176 |
| Kiowa | 0.0 /100 | #328 | Tragic $45,094 |
| Yakama | 0.0 /100 | #329 | Tragic $45,002 |
| Immigrants | Mexico | 0.0 /100 | #330 | Tragic $44,960 |
| Natives/Alaskans | 0.0 /100 | #331 | Tragic $44,775 |
| Bahamians | 0.0 /100 | #332 | Tragic $44,756 |
| Immigrants | Congo | 0.0 /100 | #333 | Tragic $44,204 |
| Immigrants | Yemen | 0.0 /100 | #334 | Tragic $44,083 |
| Spanish American Indians | 0.0 /100 | #335 | Tragic $44,010 |
| Immigrants | Cuba | 0.0 /100 | #336 | Tragic $43,461 |
| Menominee | 0.0 /100 | #337 | Tragic $42,581 |
| Crow | 0.0 /100 | #338 | Tragic $42,434 |
| Pima | 0.0 /100 | #339 | Tragic $42,357 |
Demographics Similar to New Zealanders by Median Male Earnings
In terms of median male earnings, the demographic groups most similar to New Zealanders are Immigrants from Scotland ($61,220, a difference of 0.030%), Lithuanian ($61,228, a difference of 0.050%), Greek ($61,242, a difference of 0.070%), Immigrants from Netherlands ($61,096, a difference of 0.17%), and Egyptian ($61,095, a difference of 0.17%).
| Demographics | Rating | Rank | Median Male Earnings |
| Estonians | 99.9 /100 | #51 | Exceptional $61,710 |
| Immigrants | Norway | 99.9 /100 | #52 | Exceptional $61,628 |
| South Africans | 99.9 /100 | #53 | Exceptional $61,460 |
| Immigrants | Latvia | 99.9 /100 | #54 | Exceptional $61,422 |
| Greeks | 99.9 /100 | #55 | Exceptional $61,242 |
| Lithuanians | 99.9 /100 | #56 | Exceptional $61,228 |
| Immigrants | Scotland | 99.9 /100 | #57 | Exceptional $61,220 |
| New Zealanders | 99.9 /100 | #58 | Exceptional $61,199 |
| Immigrants | Netherlands | 99.8 /100 | #59 | Exceptional $61,096 |
| Egyptians | 99.8 /100 | #60 | Exceptional $61,095 |
| Bolivians | 99.8 /100 | #61 | Exceptional $61,066 |
| Immigrants | Romania | 99.8 /100 | #62 | Exceptional $61,040 |
| Immigrants | Pakistan | 99.8 /100 | #63 | Exceptional $60,987 |
| Immigrants | Eastern Europe | 99.8 /100 | #64 | Exceptional $60,958 |
| Immigrants | Indonesia | 99.8 /100 | #65 | Exceptional $60,935 |