Armenian vs Spanish American Indian Per Capita Income
COMPARE
Armenian
Spanish American Indian
Per Capita Income
Per Capita Income Comparison
Armenians
Spanish American Indians
$48,287
PER CAPITA INCOME
99.4/ 100
METRIC RATING
81st/ 347
METRIC RANK
$34,195
PER CAPITA INCOME
0.0/ 100
METRIC RATING
330th/ 347
METRIC RANK
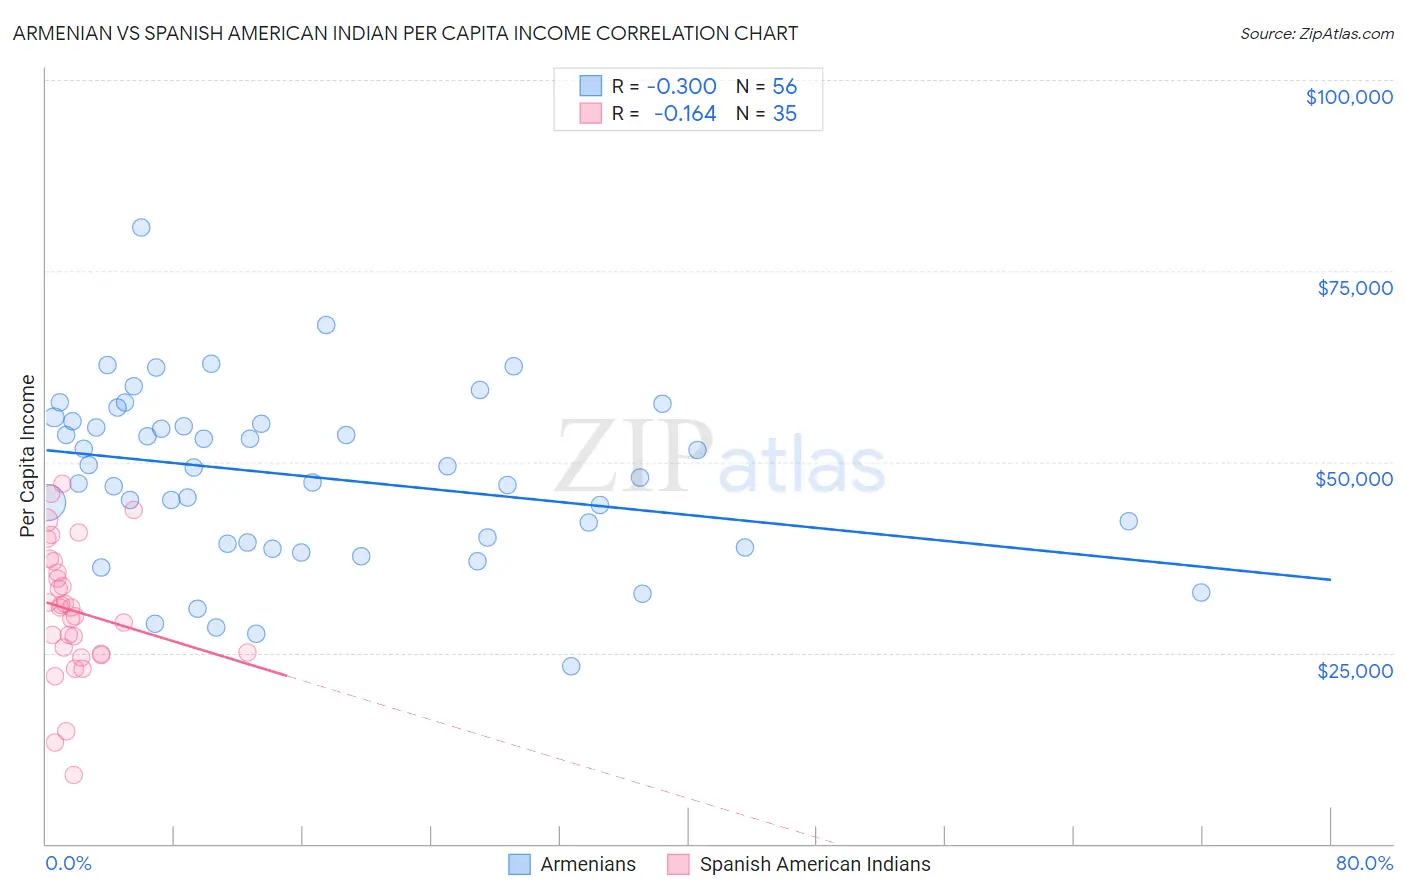
Armenian vs Spanish American Indian Per Capita Income Correlation Chart
The statistical analysis conducted on geographies consisting of 310,965,464 people shows a mild negative correlation between the proportion of Armenians and per capita income in the United States with a correlation coefficient (R) of -0.300 and weighted average of $48,287. Similarly, the statistical analysis conducted on geographies consisting of 73,150,359 people shows a poor negative correlation between the proportion of Spanish American Indians and per capita income in the United States with a correlation coefficient (R) of -0.164 and weighted average of $34,195, a difference of 41.2%.
Per Capita Income Correlation Summary
| Measurement | Armenian | Spanish American Indian |
| Minimum | $23,281 | $9,061 |
| Maximum | $80,691 | $47,199 |
| Range | $57,410 | $38,138 |
| Mean | $48,045 | $30,495 |
| Median | $48,616 | $30,854 |
| Interquartile 25% (IQ1) | $39,345 | $24,953 |
| Interquartile 75% (IQ3) | $55,100 | $37,015 |
| Interquartile Range (IQR) | $15,755 | $12,062 |
| Standard Deviation (Sample) | $11,238 | $8,840 |
| Standard Deviation (Population) | $11,138 | $8,713 |
Similar Demographics by Per Capita Income
Demographics Similar to Armenians by Per Capita Income
In terms of per capita income, the demographic groups most similar to Armenians are Egyptian ($48,358, a difference of 0.15%), Immigrants from Indonesia ($48,195, a difference of 0.19%), Immigrants from Brazil ($48,164, a difference of 0.26%), Immigrants from Ukraine ($48,134, a difference of 0.32%), and Romanian ($48,445, a difference of 0.33%).
| Demographics | Rating | Rank | Per Capita Income |
| Mongolians | 99.8 /100 | #74 | Exceptional $49,173 |
| Immigrants | Bolivia | 99.7 /100 | #75 | Exceptional $48,970 |
| Immigrants | England | 99.7 /100 | #76 | Exceptional $48,844 |
| Immigrants | Kazakhstan | 99.7 /100 | #77 | Exceptional $48,747 |
| Immigrants | Italy | 99.6 /100 | #78 | Exceptional $48,654 |
| Romanians | 99.5 /100 | #79 | Exceptional $48,445 |
| Egyptians | 99.5 /100 | #80 | Exceptional $48,358 |
| Armenians | 99.4 /100 | #81 | Exceptional $48,287 |
| Immigrants | Indonesia | 99.4 /100 | #82 | Exceptional $48,195 |
| Immigrants | Brazil | 99.4 /100 | #83 | Exceptional $48,164 |
| Immigrants | Ukraine | 99.3 /100 | #84 | Exceptional $48,134 |
| Austrians | 99.3 /100 | #85 | Exceptional $48,116 |
| Immigrants | Southern Europe | 99.3 /100 | #86 | Exceptional $48,027 |
| Ukrainians | 99.3 /100 | #87 | Exceptional $48,014 |
| Croatians | 99.0 /100 | #88 | Exceptional $47,742 |
Demographics Similar to Spanish American Indians by Per Capita Income
In terms of per capita income, the demographic groups most similar to Spanish American Indians are Immigrants from Mexico ($33,931, a difference of 0.78%), Sioux ($33,921, a difference of 0.81%), Mexican ($34,559, a difference of 1.1%), Menominee ($34,578, a difference of 1.1%), and Immigrants from Yemen ($33,696, a difference of 1.5%).
| Demographics | Rating | Rank | Per Capita Income |
| Cheyenne | 0.0 /100 | #323 | Tragic $35,276 |
| Kiowa | 0.0 /100 | #324 | Tragic $35,102 |
| Immigrants | Central America | 0.0 /100 | #325 | Tragic $34,974 |
| Immigrants | Cuba | 0.0 /100 | #326 | Tragic $34,910 |
| Apache | 0.0 /100 | #327 | Tragic $34,886 |
| Menominee | 0.0 /100 | #328 | Tragic $34,578 |
| Mexicans | 0.0 /100 | #329 | Tragic $34,559 |
| Spanish American Indians | 0.0 /100 | #330 | Tragic $34,195 |
| Immigrants | Mexico | 0.0 /100 | #331 | Tragic $33,931 |
| Sioux | 0.0 /100 | #332 | Tragic $33,921 |
| Immigrants | Yemen | 0.0 /100 | #333 | Tragic $33,696 |
| Natives/Alaskans | 0.0 /100 | #334 | Tragic $33,279 |
| Yuman | 0.0 /100 | #335 | Tragic $33,236 |
| Yakama | 0.0 /100 | #336 | Tragic $33,009 |
| Houma | 0.0 /100 | #337 | Tragic $32,996 |