Armenian vs Immigrants from Zaire Male Disability
COMPARE
Armenian
Immigrants from Zaire
Male Disability
Male Disability Comparison
Armenians
Immigrants from Zaire
10.9%
MALE DISABILITY
90.1/ 100
METRIC RATING
119th/ 347
METRIC RANK
11.4%
MALE DISABILITY
27.6/ 100
METRIC RATING
186th/ 347
METRIC RANK
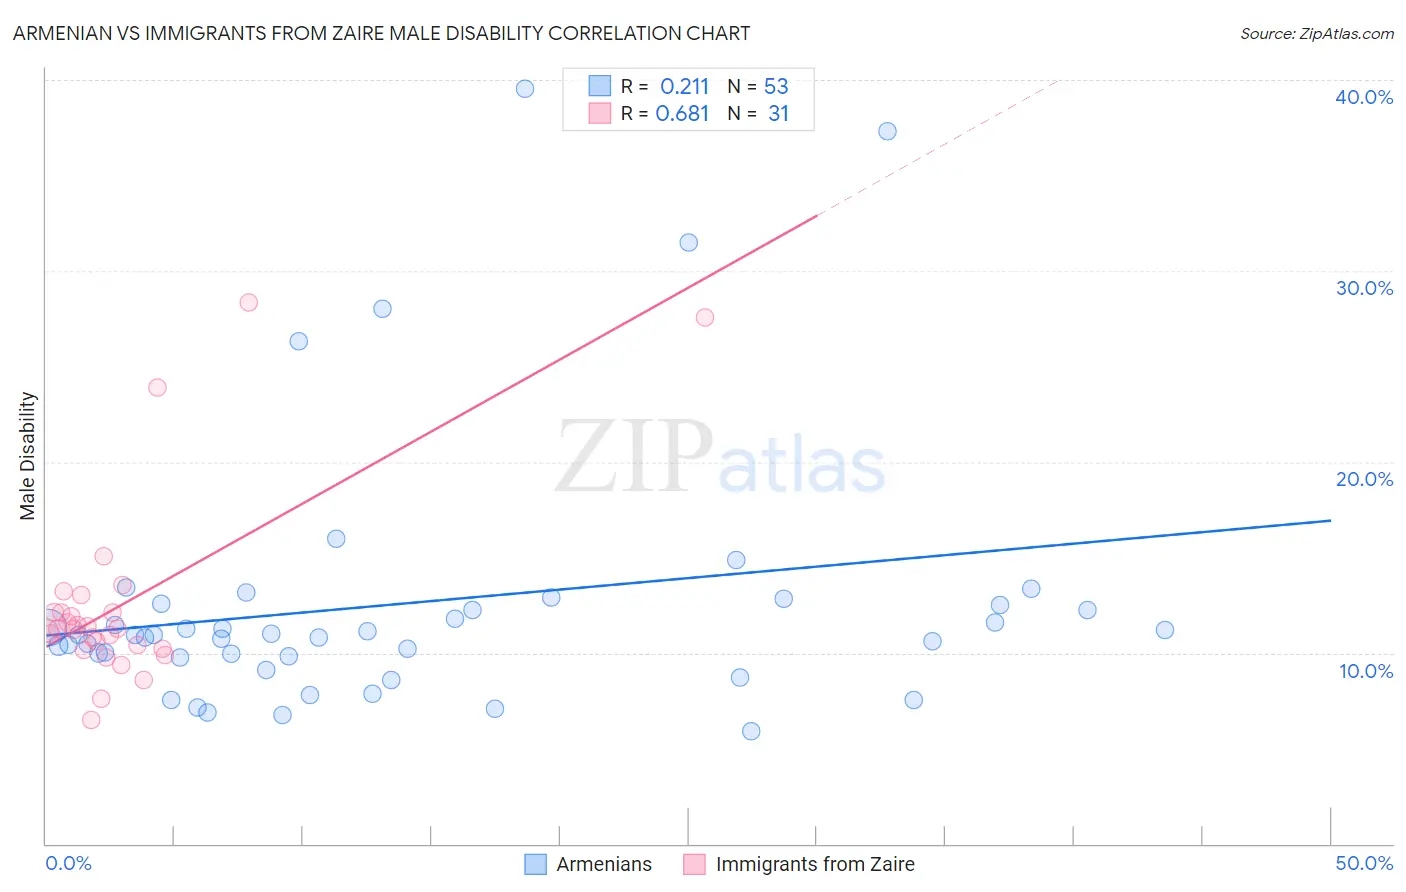
Armenian vs Immigrants from Zaire Male Disability Correlation Chart
The statistical analysis conducted on geographies consisting of 310,935,908 people shows a weak positive correlation between the proportion of Armenians and percentage of males with a disability in the United States with a correlation coefficient (R) of 0.211 and weighted average of 10.9%. Similarly, the statistical analysis conducted on geographies consisting of 107,255,080 people shows a significant positive correlation between the proportion of Immigrants from Zaire and percentage of males with a disability in the United States with a correlation coefficient (R) of 0.681 and weighted average of 11.4%, a difference of 4.5%.
Male Disability Correlation Summary
| Measurement | Armenian | Immigrants from Zaire |
| Minimum | 5.9% | 6.5% |
| Maximum | 39.5% | 28.4% |
| Range | 33.7% | 21.9% |
| Mean | 12.6% | 12.5% |
| Median | 10.9% | 11.2% |
| Interquartile 25% (IQ1) | 9.8% | 10.2% |
| Interquartile 75% (IQ3) | 12.5% | 12.1% |
| Interquartile Range (IQR) | 2.8% | 1.9% |
| Standard Deviation (Sample) | 7.0% | 5.0% |
| Standard Deviation (Population) | 6.9% | 4.9% |
Similar Demographics by Male Disability
Demographics Similar to Armenians by Male Disability
In terms of male disability, the demographic groups most similar to Armenians are Immigrants from Cuba (10.9%, a difference of 0.0%), Eastern European (10.9%, a difference of 0.080%), Immigrants from Africa (10.9%, a difference of 0.11%), Immigrants from South Eastern Asia (10.9%, a difference of 0.15%), and Immigrants from Ghana (10.9%, a difference of 0.17%).
| Demographics | Rating | Rank | Male Disability |
| Ghanaians | 93.4 /100 | #112 | Exceptional 10.8% |
| Immigrants | Zimbabwe | 93.0 /100 | #113 | Exceptional 10.8% |
| Central Americans | 92.7 /100 | #114 | Exceptional 10.8% |
| Immigrants | Barbados | 92.2 /100 | #115 | Exceptional 10.8% |
| Immigrants | South Africa | 91.8 /100 | #116 | Exceptional 10.8% |
| Eastern Europeans | 90.6 /100 | #117 | Exceptional 10.9% |
| Immigrants | Cuba | 90.2 /100 | #118 | Exceptional 10.9% |
| Armenians | 90.1 /100 | #119 | Exceptional 10.9% |
| Immigrants | Africa | 89.4 /100 | #120 | Excellent 10.9% |
| Immigrants | South Eastern Asia | 89.2 /100 | #121 | Excellent 10.9% |
| Immigrants | Ghana | 89.0 /100 | #122 | Excellent 10.9% |
| Immigrants | Czechoslovakia | 88.4 /100 | #123 | Excellent 10.9% |
| South American Indians | 88.1 /100 | #124 | Excellent 10.9% |
| Immigrants | North Macedonia | 88.1 /100 | #125 | Excellent 10.9% |
| Immigrants | Trinidad and Tobago | 86.9 /100 | #126 | Excellent 10.9% |
Demographics Similar to Immigrants from Zaire by Male Disability
In terms of male disability, the demographic groups most similar to Immigrants from Zaire are Immigrants from Austria (11.4%, a difference of 0.020%), Estonian (11.4%, a difference of 0.060%), Immigrants from Netherlands (11.4%, a difference of 0.12%), Immigrants from Bosnia and Herzegovina (11.4%, a difference of 0.16%), and Pakistani (11.3%, a difference of 0.18%).
| Demographics | Rating | Rank | Male Disability |
| Immigrants | Caribbean | 41.4 /100 | #179 | Average 11.3% |
| Hondurans | 41.1 /100 | #180 | Average 11.3% |
| Immigrants | Senegal | 34.4 /100 | #181 | Fair 11.3% |
| Immigrants | Belize | 33.7 /100 | #182 | Fair 11.3% |
| Immigrants | Central America | 32.9 /100 | #183 | Fair 11.3% |
| Iraqis | 30.5 /100 | #184 | Fair 11.3% |
| Pakistanis | 30.3 /100 | #185 | Fair 11.3% |
| Immigrants | Zaire | 27.6 /100 | #186 | Fair 11.4% |
| Immigrants | Austria | 27.3 /100 | #187 | Fair 11.4% |
| Estonians | 26.8 /100 | #188 | Fair 11.4% |
| Immigrants | Netherlands | 25.9 /100 | #189 | Fair 11.4% |
| Immigrants | Bosnia and Herzegovina | 25.4 /100 | #190 | Fair 11.4% |
| Senegalese | 23.2 /100 | #191 | Fair 11.4% |
| Assyrians/Chaldeans/Syriacs | 23.2 /100 | #192 | Fair 11.4% |
| Greeks | 22.2 /100 | #193 | Fair 11.4% |