Alsatian vs Immigrants from Hong Kong Median Family Income
COMPARE
Alsatian
Immigrants from Hong Kong
Median Family Income
Median Family Income Comparison
Alsatians
Immigrants from Hong Kong
$103,010
MEDIAN FAMILY INCOME
54.3/ 100
METRIC RATING
171st/ 347
METRIC RANK
$131,067
MEDIAN FAMILY INCOME
100.0/ 100
METRIC RATING
7th/ 347
METRIC RANK
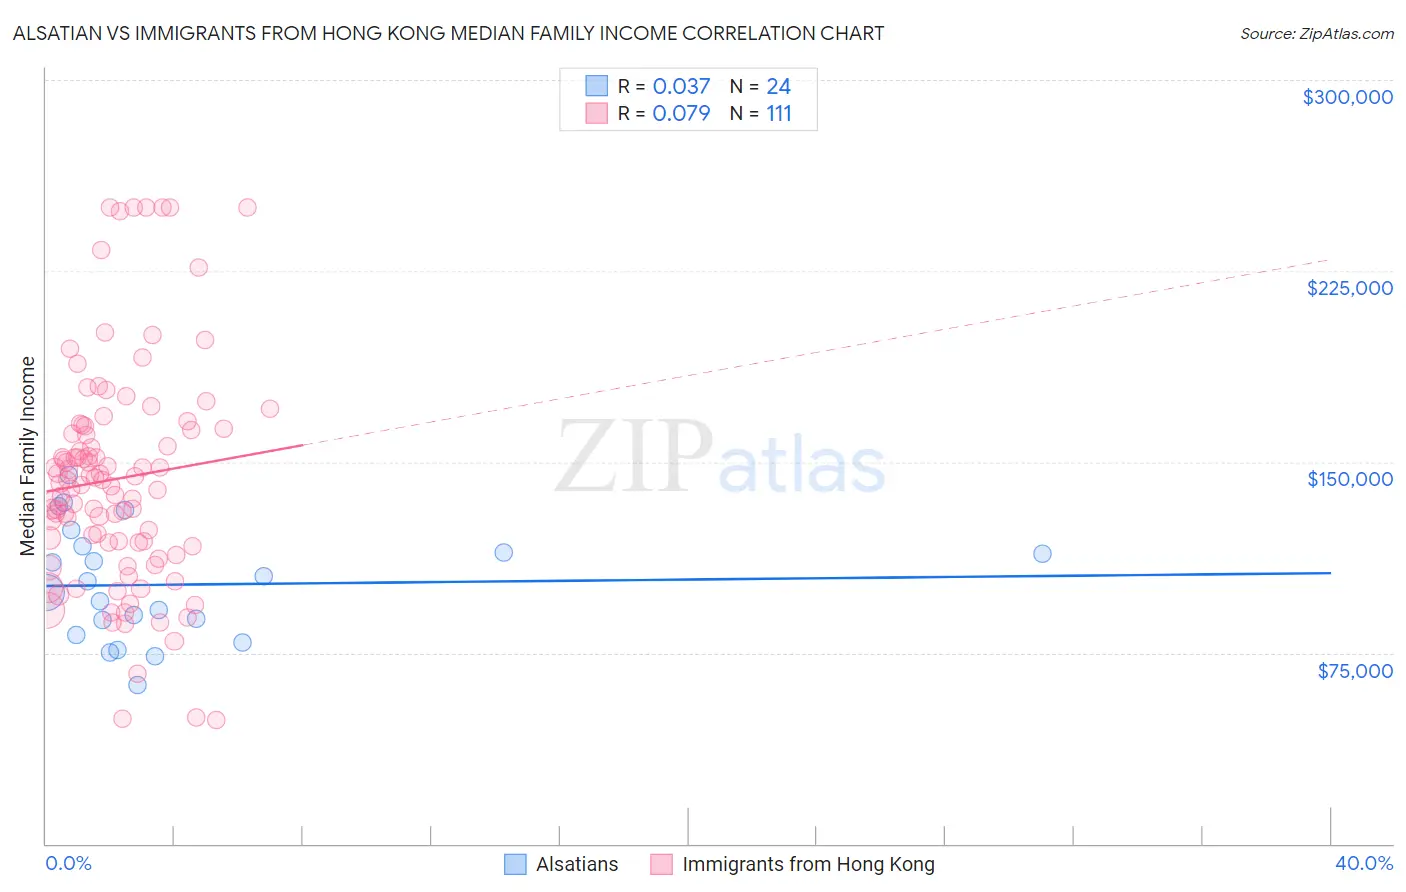
Alsatian vs Immigrants from Hong Kong Median Family Income Correlation Chart
The statistical analysis conducted on geographies consisting of 82,676,924 people shows no correlation between the proportion of Alsatians and median family income in the United States with a correlation coefficient (R) of 0.037 and weighted average of $103,010. Similarly, the statistical analysis conducted on geographies consisting of 253,853,035 people shows a slight positive correlation between the proportion of Immigrants from Hong Kong and median family income in the United States with a correlation coefficient (R) of 0.079 and weighted average of $131,067, a difference of 27.2%.
Median Family Income Correlation Summary
| Measurement | Alsatian | Immigrants from Hong Kong |
| Minimum | $62,500 | $48,750 |
| Maximum | $144,746 | $250,001 |
| Range | $82,246 | $201,251 |
| Mean | $101,763 | $143,316 |
| Median | $100,794 | $141,440 |
| Interquartile 25% (IQ1) | $85,164 | $118,209 |
| Interquartile 75% (IQ3) | $115,830 | $163,135 |
| Interquartile Range (IQR) | $30,667 | $44,926 |
| Standard Deviation (Sample) | $22,004 | $43,770 |
| Standard Deviation (Population) | $21,541 | $43,572 |
Similar Demographics by Median Family Income
Demographics Similar to Alsatians by Median Family Income
In terms of median family income, the demographic groups most similar to Alsatians are Immigrants from Uzbekistan ($103,197, a difference of 0.18%), Immigrants from Eritrea ($102,823, a difference of 0.18%), Belgian ($102,788, a difference of 0.22%), Czechoslovakian ($103,273, a difference of 0.26%), and Finnish ($102,676, a difference of 0.33%).
| Demographics | Rating | Rank | Median Family Income |
| Sierra Leoneans | 64.7 /100 | #164 | Good $103,859 |
| Slovaks | 63.1 /100 | #165 | Good $103,729 |
| English | 62.6 /100 | #166 | Good $103,684 |
| South American Indians | 61.9 /100 | #167 | Good $103,624 |
| Immigrants | Peru | 60.8 /100 | #168 | Good $103,534 |
| Czechoslovakians | 57.6 /100 | #169 | Average $103,273 |
| Immigrants | Uzbekistan | 56.6 /100 | #170 | Average $103,197 |
| Alsatians | 54.3 /100 | #171 | Average $103,010 |
| Immigrants | Eritrea | 51.9 /100 | #172 | Average $102,823 |
| Belgians | 51.4 /100 | #173 | Average $102,788 |
| Finns | 50.0 /100 | #174 | Average $102,676 |
| Immigrants | Eastern Africa | 47.1 /100 | #175 | Average $102,451 |
| French | 46.1 /100 | #176 | Average $102,368 |
| Germans | 44.6 /100 | #177 | Average $102,254 |
| Welsh | 43.3 /100 | #178 | Average $102,151 |
Demographics Similar to Immigrants from Hong Kong by Median Family Income
In terms of median family income, the demographic groups most similar to Immigrants from Hong Kong are Immigrants from Iran ($130,894, a difference of 0.13%), Thai ($131,281, a difference of 0.16%), Okinawan ($129,979, a difference of 0.84%), Iranian ($133,839, a difference of 2.1%), and Immigrants from India ($134,028, a difference of 2.3%).
| Demographics | Rating | Rank | Median Family Income |
| Filipinos | 100.0 /100 | #1 | Exceptional $138,397 |
| Immigrants | Taiwan | 100.0 /100 | #2 | Exceptional $136,949 |
| Immigrants | Singapore | 100.0 /100 | #3 | Exceptional $134,818 |
| Immigrants | India | 100.0 /100 | #4 | Exceptional $134,028 |
| Iranians | 100.0 /100 | #5 | Exceptional $133,839 |
| Thais | 100.0 /100 | #6 | Exceptional $131,281 |
| Immigrants | Hong Kong | 100.0 /100 | #7 | Exceptional $131,067 |
| Immigrants | Iran | 100.0 /100 | #8 | Exceptional $130,894 |
| Okinawans | 100.0 /100 | #9 | Exceptional $129,979 |
| Immigrants | Ireland | 100.0 /100 | #10 | Exceptional $127,584 |
| Immigrants | Israel | 100.0 /100 | #11 | Exceptional $127,430 |
| Cypriots | 100.0 /100 | #12 | Exceptional $127,064 |
| Immigrants | Australia | 100.0 /100 | #13 | Exceptional $126,620 |
| Immigrants | South Central Asia | 100.0 /100 | #14 | Exceptional $125,956 |
| Eastern Europeans | 100.0 /100 | #15 | Exceptional $125,546 |