African vs Immigrants from Cameroon Median Male Earnings
COMPARE
African
Immigrants from Cameroon
Median Male Earnings
Median Male Earnings Comparison
Africans
Immigrants from Cameroon
$47,994
MEDIAN MALE EARNINGS
0.2/ 100
METRIC RATING
284th/ 347
METRIC RANK
$52,119
MEDIAN MALE EARNINGS
8.9/ 100
METRIC RATING
215th/ 347
METRIC RANK
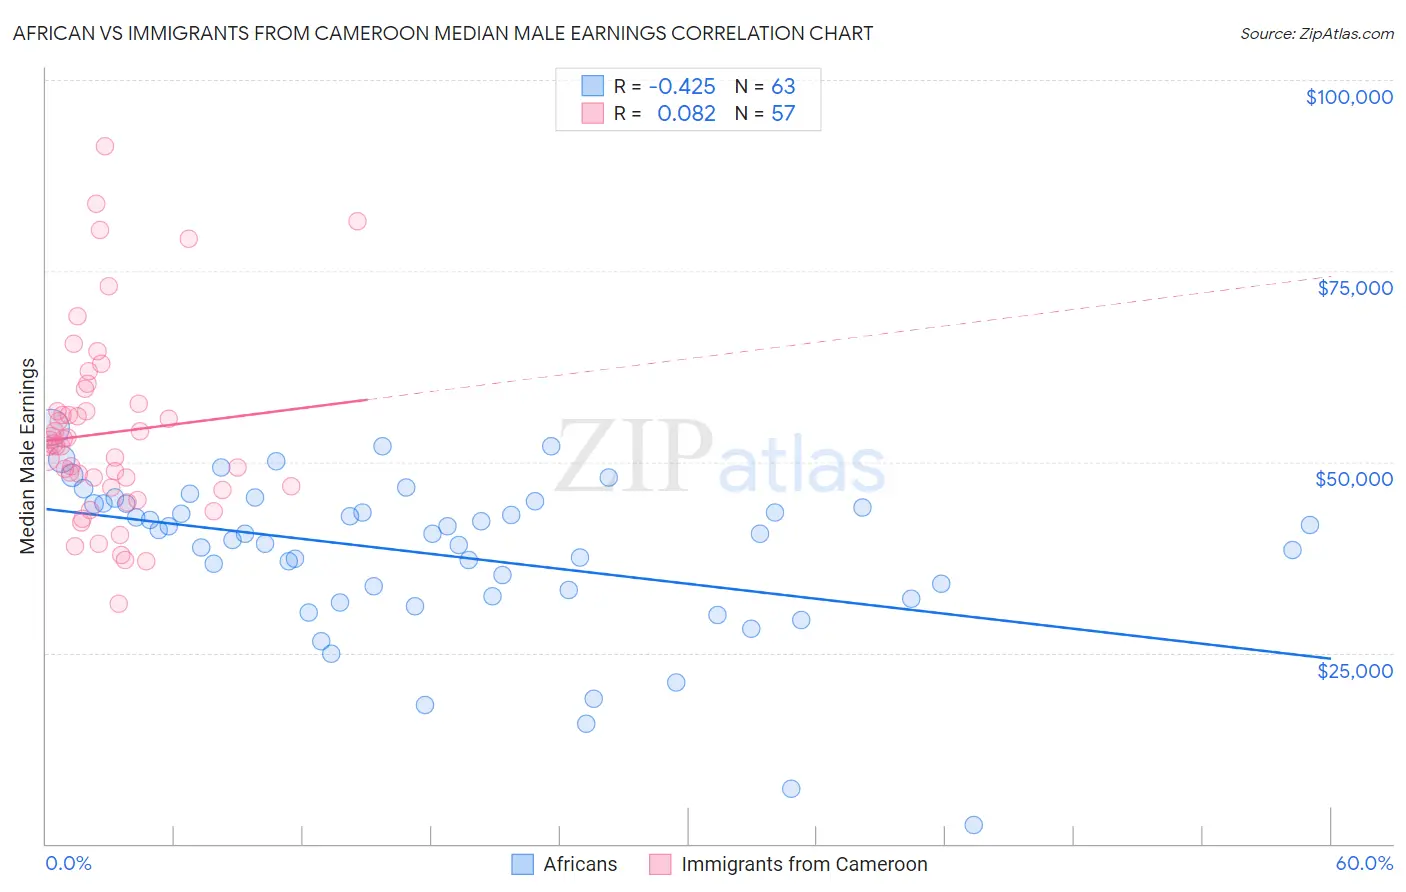
African vs Immigrants from Cameroon Median Male Earnings Correlation Chart
The statistical analysis conducted on geographies consisting of 469,793,232 people shows a moderate negative correlation between the proportion of Africans and median male earnings in the United States with a correlation coefficient (R) of -0.425 and weighted average of $47,994. Similarly, the statistical analysis conducted on geographies consisting of 130,759,044 people shows a slight positive correlation between the proportion of Immigrants from Cameroon and median male earnings in the United States with a correlation coefficient (R) of 0.082 and weighted average of $52,119, a difference of 8.6%.
Median Male Earnings Correlation Summary
| Measurement | African | Immigrants from Cameroon |
| Minimum | $2,499 | $31,418 |
| Maximum | $54,569 | $91,296 |
| Range | $52,070 | $59,878 |
| Mean | $37,853 | $53,781 |
| Median | $40,627 | $52,076 |
| Interquartile 25% (IQ1) | $32,413 | $46,476 |
| Interquartile 75% (IQ3) | $44,491 | $57,139 |
| Interquartile Range (IQR) | $12,079 | $10,663 |
| Standard Deviation (Sample) | $10,360 | $12,326 |
| Standard Deviation (Population) | $10,278 | $12,218 |
Similar Demographics by Median Male Earnings
Demographics Similar to Africans by Median Male Earnings
In terms of median male earnings, the demographic groups most similar to Africans are Paiute ($47,991, a difference of 0.010%), Mexican American Indian ($47,990, a difference of 0.010%), Immigrants from El Salvador ($47,973, a difference of 0.040%), Immigrants from Jamaica ($48,040, a difference of 0.090%), and Shoshone ($47,930, a difference of 0.13%).
| Demographics | Rating | Rank | Median Male Earnings |
| Belizeans | 0.2 /100 | #277 | Tragic $48,358 |
| Immigrants | Liberia | 0.2 /100 | #278 | Tragic $48,317 |
| Hmong | 0.2 /100 | #279 | Tragic $48,254 |
| Comanche | 0.2 /100 | #280 | Tragic $48,202 |
| Marshallese | 0.2 /100 | #281 | Tragic $48,137 |
| Central Americans | 0.2 /100 | #282 | Tragic $48,093 |
| Immigrants | Jamaica | 0.2 /100 | #283 | Tragic $48,040 |
| Africans | 0.2 /100 | #284 | Tragic $47,994 |
| Paiute | 0.2 /100 | #285 | Tragic $47,991 |
| Mexican American Indians | 0.2 /100 | #286 | Tragic $47,990 |
| Immigrants | El Salvador | 0.2 /100 | #287 | Tragic $47,973 |
| Shoshone | 0.2 /100 | #288 | Tragic $47,930 |
| Chickasaw | 0.1 /100 | #289 | Tragic $47,832 |
| Immigrants | Belize | 0.1 /100 | #290 | Tragic $47,809 |
| Choctaw | 0.1 /100 | #291 | Tragic $47,729 |
Demographics Similar to Immigrants from Cameroon by Median Male Earnings
In terms of median male earnings, the demographic groups most similar to Immigrants from Cameroon are Nonimmigrants ($52,170, a difference of 0.10%), Immigrants from Venezuela ($52,041, a difference of 0.15%), Nigerian ($52,039, a difference of 0.15%), Immigrants from Panama ($51,962, a difference of 0.30%), and Native Hawaiian ($52,306, a difference of 0.36%).
| Demographics | Rating | Rank | Median Male Earnings |
| Venezuelans | 12.5 /100 | #208 | Poor $52,510 |
| Bermudans | 12.1 /100 | #209 | Poor $52,465 |
| Delaware | 11.5 /100 | #210 | Poor $52,412 |
| Tlingit-Haida | 11.5 /100 | #211 | Poor $52,409 |
| Cajuns | 10.7 /100 | #212 | Poor $52,325 |
| Native Hawaiians | 10.5 /100 | #213 | Poor $52,306 |
| Immigrants | Nonimmigrants | 9.3 /100 | #214 | Tragic $52,170 |
| Immigrants | Cameroon | 8.9 /100 | #215 | Tragic $52,119 |
| Immigrants | Venezuela | 8.3 /100 | #216 | Tragic $52,041 |
| Nigerians | 8.3 /100 | #217 | Tragic $52,039 |
| Immigrants | Panama | 7.7 /100 | #218 | Tragic $51,962 |
| Immigrants | Ghana | 6.9 /100 | #219 | Tragic $51,836 |
| Immigrants | Armenia | 6.6 /100 | #220 | Tragic $51,793 |
| Immigrants | Senegal | 5.8 /100 | #221 | Tragic $51,647 |
| Immigrants | Bangladesh | 5.8 /100 | #222 | Tragic $51,642 |